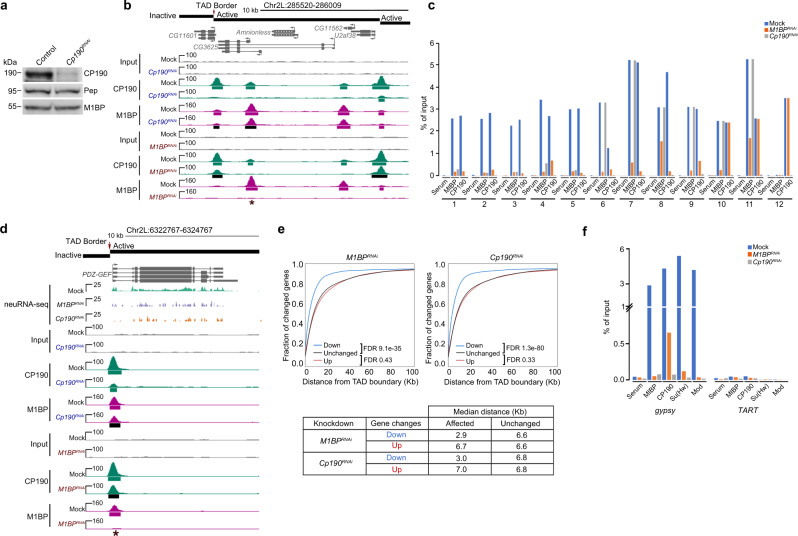
Fig. 6. M1BP association with chromatin is facilitated by CP190 at a subset of sites.
a Western blotting of total lysates from Kc control and Cp190 knockdown cells with Pep used as loading control. This experiment was performed for three independent biological replicates with similar results. b Example screenshot of ChIP-seq profiles for lost CP190 peak in M1BPRNAi and lost M1BP peak in Cp190RNAi are shown. Asterisk indicates the particular interdependent peak measured in (c), site 1. Called ChIP-seq peaks in either knockdown condition shown in black are significantly decreased in the knockdown of the opposite factor. c Differentially bound M1BP and CP190 ChIP-seq peaks in M1BP knockdown and Cp190 knockdown validated by ChIP-qPCR. Validation of selected differentially decreased peaks of M1BP and CP190 (sites 1–5) and negative control sites (sites 10 and 11). Validation of decreased peaks of CP190 (sites 6–9) and negative control site 12. Percentage input chromatin DNA precipitated is shown for each primer set, and average values from n = 2 biological replicates measured using four technical replicates are plotted. Detailed description of each site labeled is summarized in Supplementary Table 5 and Ct values are available in Source Data 7. d Example screenshot showing promoter association of M1BP and CP190 is interdependent for downregulated genes in either knockdown of M1BP or Cp190. In most cases, both proteins localize at TAD borders. For simplicity, only replicate 1 of mock, M1BPRNAi, and Cp190RNAi is shown for neuRNA-seq tracks. e Cumulative histograms of promoter distance from closest TAD border classified by change in nascent expression in M1BP (left) or Cp190 (right) knockdown cells. Downregulated (blue), upregulated (red), or unchanged (black) genes are indicated. Table indicates the median distance from closest TAD border for down- and upregulated genes compared to unchanged genes in either knockdown condition. Mann–Whitney U test for each set of changed genes against unchanged genes are shown. Analysis of TADs classified by chromatin state is shown in Supplementary Fig. 6. f Percentage of precipitated input chromatin DNA from ChIP-qPCR of M1BP, Su(Hw), Mod(mdg4)67.2, and CP190 at Su(Hw)-binding sites of gypsy or TART transposon sites as a negative control in Kc cells either mock-treated or subjected to M1BPRNAi or Cp190RNAi. Average of n = 2 biological replicates measured using four technical replicates are plotted. Ct values are provided in Source Data 7.

