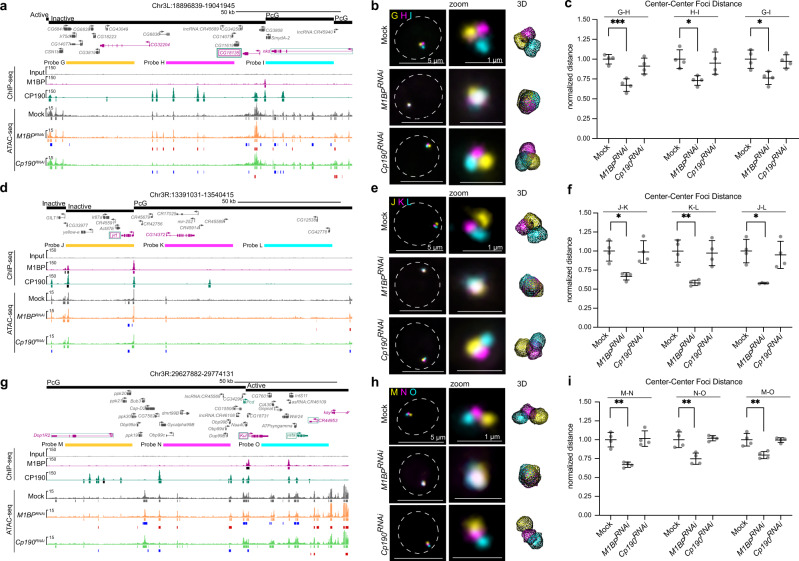
Fig. 8. Knockdown of M1BP increases local inter-TAD and intra-TAD genome compaction.
a, d, g Regions detected by 32 kb probes spaced 15 kb apart (a probes G, H, I; d probes J, K, L; g probes M, N, O). TADs with state classification, longest gene isoform, ChIP-seq signals, and called peaks (black significantly decreased in knockdown of opposite factor) are shown. ATAC-seq signals and called peaks, decreased peaks relative to mock (blue), and increased peaks (red) are shown. Upregulated genes in either M1BP or Cp190 knockdown are shown in purple or green, respectively. Downregulated genes in either M1BP or Cp190 knockdowns text outlined with a box are shown in purple or green, respectively. Note that nkd, Dop1R2, and CR44953 are upregulated in both knockdowns, and CG18135, yrt and Kul are downregulated in both knockdowns. b, e, h Left: representative nuclei labeled with probes in a, d, and g, respectively. Max projection of approximately 5 Z slices. Dashed line represents nuclear edge. Center: zoom of FISH signals. Right: TANGO 3D mesh rendering. c, f, i Dot plots showing average pairwise center-to-center distances between probes in a, d, and g, respectively. Data represented as mean of all replicates (mid-line) ± SD (error bars). Each dot represents the average of one replicate. Single-cell distances were normalized to nuclear radius before population averages were calculated. All averages were normalized to average of mock controls. Only cells in G1 were measured for these analyses. Data are from four biological replicates. See Supplementary Tables 10–12 for “n” of cells examined per replicate. Unpaired t-test (two-tailed) of means before normalization to controls (*P < 0.05, **P < 0.01, ***P < 0.001). Exact P values can be found in Supplementary Table 13.

