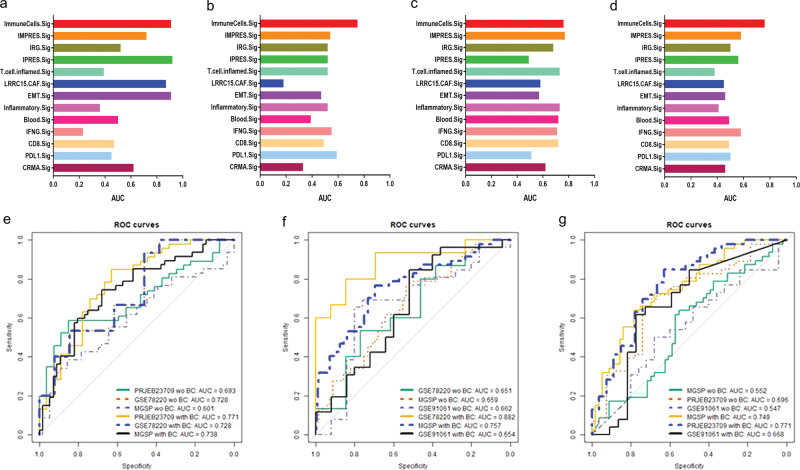
Fig. 2. Comparison of the performance of ImmuneCells.Sig with other ICT (immune checkpoint therapy) response signatures and independent validation of ImmuneCells.Sig without or with batch effect correction.
The multiple bar plots of the fivefold cross-validation calculated mean testing AUC (Area Under The Curve) values of the whole 13 ICT signatures are shown in a For the GSE78220 data set. b For the GSE91061 data set. c For the PRJEB23709 data set. d For the MGSP data set. e Testing the predictivity of the ImmuneCells.Sig trained in the GSE91061 data set in the other three independent data sets—PRJEB23709, GSE78220, and MGSP without or with batch effect correction. f Testing the predictivity of the ImmuneCells.Sig trained in the PRJEB23709 data set in the other three independent data sets—GSE78220, MGSP, and GSE91061 without or with batch effect correction. g Testing the predictivity of the ImmuneCells.Sig trained in the GSE78220 data set in the other three independent data sets—MGSP, PRJEB23709, and GSE91061 without or with batch effect correction.

