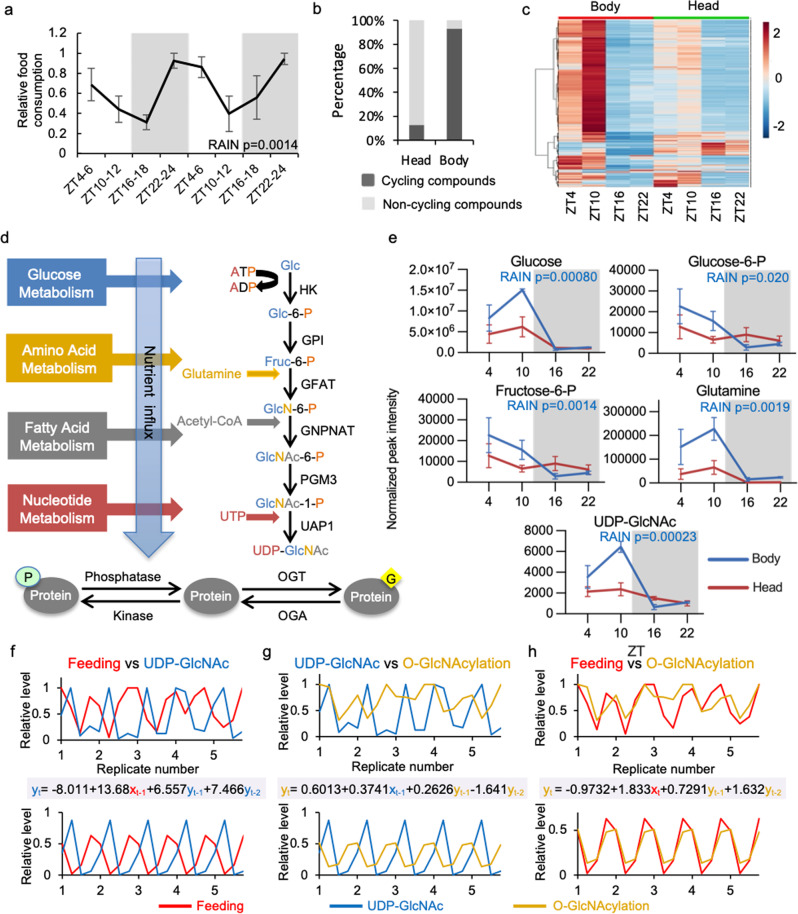
Fig. 2. Daily feeding-fasting cycle generates oscillation in metabolites in flies.
a Feeding rhythm of wild type (w1118) male flies over two consecutive days as measured by CAFE assay. Data were normalized (peak feeding = 1) and presented as mean ± SEM (n = 3, 10 flies per biological replicate; p = 0.0014; RAIN). The grey shading indicates the dark phase of each day-night cycle. b Percentage of cycling and non-cycling metabolites in male fly heads and bodies detected by GC-MS (n = 5 or 6; p < 0.05; RAIN). c Heat map of all metabolites detected in male heads and bodies (n = 5 or 6). Normalized peak intensity of all metabolites were pareto scaled. Each line represents one detected compound. d Schematic showing hexosamine biosynthetic pathway (HBP) integrating cellular metabolic status to provide UDP-GlcNAc as output (format of diagram modified from Hart et al., 201116). HK Hexokinase, GPI Phosphoglucose isomerase, GFAT Glutamine--fructose-6-phosphate aminotransferase, GNPNAT Glucosamine-phosphate N-acetyltransferase, PGM3 Phosphoacetylglucosamine mutase, UAP1 UDP-N-Acetyl glucosamine pyrophosphorylase 1, OGT O-GlcNAc transferase, OGA O-GlcNAcase. Glc glucose, Glc-6-P Glucose-6-phosphate, Fruc-6-P Fructose-6-phosphate, GlcN-6-P Glucosamine-6-phosphate, GlcNAc-6-P N-acetylglucosamine-6-phosphate, GlcNAc-1-P N-acetylglucosamine-1-phosphate, UTP Uridine triphosphate, UDP-GlcNAc Uridine diphosphate N-acetylglucosamine. e Line graphs showing daily oscillations of HBP metabolites in fly bodies and heads (n = 5 or 6). Data were presented as mean ± SEM. P values indicating rhythmicity (RAIN) of each of the five metabolites in fly bodies are presented on the upper right corner of each panel. p > 0.25 (RAIN) for all HBP metabolites in head samples. f–h Cross-correlation analysis between rhythms: (f) feeding and UDP-GlcNAc, (g) UDP-GlcNAc and O-GlcNAcylation, (h) feeding and O-GlcNAcylation. Top panels show the observed raw data with all biological replicates, while bottom panels indicate the rhythmic pattern extracted from the raw data using R. The correlation equations are shown between panels with the color of terms corresponding to each curve (For all the equations, R2 = 1).

