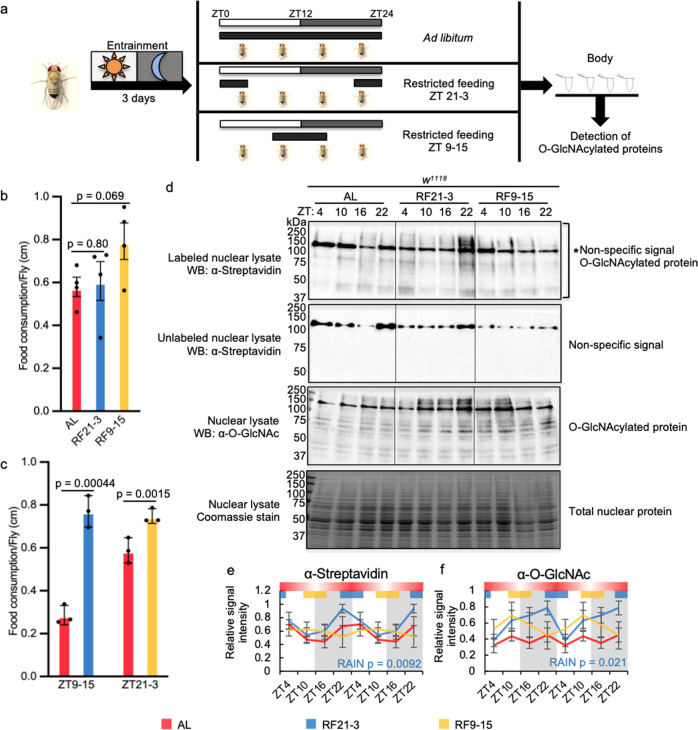
Fig. 3. Time-restricted feeding (TRF) at natural feeding time strengthens the rhythm of protein O-GlcNAcylation.
a Schematic showing the study design. The black bars indicate the time when food was available. b Food consumption of AL, RF21-3 and RF9-15 groups over a 24-h period measured using CAFE assay (n = 4, in comparison to AL group, RF21-3 p = 0.80 and RF9-15 p = 0.069, two-tailed Student’s t-test). c CAFE assay to compare food consumption of TRF groups to that of AL group during the indicated time window (n = 3, in comparison to AL group, RF21-3 p = 0.0015 and RF9-15 p = 0.00044, two-tailed Student’s t-test). Data are presented as mean ± SEM. d Western blots showing daily rhythms in O-GlcNAcylation in flies fed AL, between ZT21-3, or ZT9-15. O-GlcNAcylation was detected using two methods: (top 2 panels) chemoenzymatic labeling in combination with immunoblotting with α-streptavidin and (third panel) immunoblotting with α-O-GlcNAc. Unlabeled samples (second panel) were processed in parallel to labeled samples (top panel) to identify non-specific signal. Total nuclear proteins stained by Coomassie blue (bottom) were used for normalization. The asterisk (top panel) indicates non-specific signal. Each biological replicate was performed independently with similar results (n = 4). e, f Quantification of protein O-GlcNAcylation detected using enzymatic labeling (n = 4; AL: p = 0.045, RF21-3: p = 0.0092, RF9-15: p = 0.83, RAIN; AL vs RF21-3: mesor p = 0.05, amplitude p = 0.62, phase p = 0.3, CircaCompare) and α-O-GlcNAc immunoblotting (n = 4; AL: p = 0.83, RF21-3: p = 0.021, RF9-15: p = 0.69; RAIN). Gray shading indicates the dark period of LD cycle. Colored bars at the top of graphs denote the feeding periods for TRF treatment groups, RF21-3 (blue) and RF9-15 (yellow). The red bars with gradient shading illustrate the representative feeding pattern for AL flies (data depicted from Fig. 2a), and the darker area indicates higher feeding activity. Data are double plotted, normalized (peak=1), and presented as mean ± SEM. The biological replicates of AL group that are quantified in (e) are the same four replicates quantified in Fig. 1b. In (d), a different biological replicate of AL group, other than the one shown in Fig. 1a, was ran together on the same gel with RF21-3 and RF9-15 groups.

