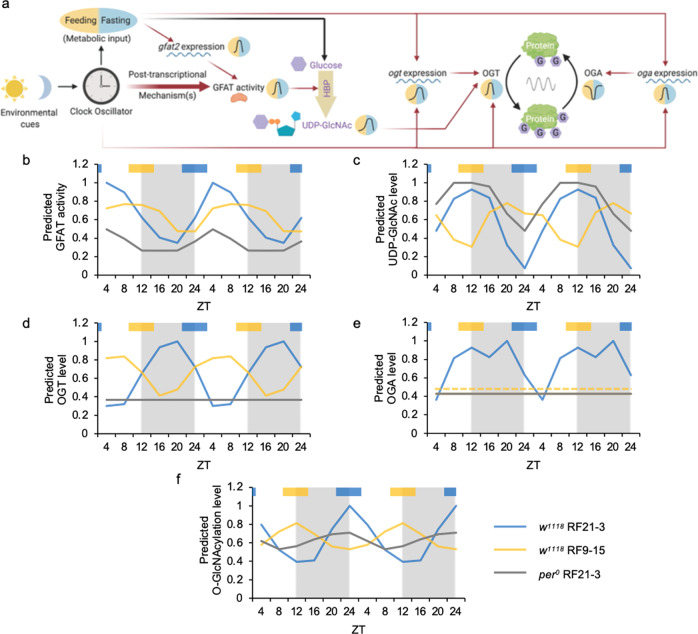
Fig. 7. A mathematical model to describe and predict daily protein O-GlcNAcylation rhythm based on molecular clock function and timing of food intake.
a Schematic model showing the regulation of protein O-GlcNAcylation by the circadian clock through feeding activity and post-transcriptional mechanism(s). Yellow background indicates feeding period while the blue background indicates fasting period. Red arrows denote activation, and the thicker red arrows denote a stronger effect. b–f Line graphs showing daily rhythms of (b) GFAT activity, (c) UDP-GlcNAc, (d) OGT protein, (e) OGA protein and (f) protein O-GlcNAcylation levels as predicted using the mathematical model (Table 1). In (e), the predicted OGA protein levels are the same in WT RF9-15 and per0 RF21-3 flies, and the two curves overlap in the graph. Therefore, a dashed line is used to indicate OGA level in WT RF9-15 group. Time of feeding for WT RF21-3, WT RF9-15 and per0 RF21-3 fly groups were used as input for the model and the circadian clock is assumed to be functional in WT but not in per0 flies. Gray shading in graph area indicates the dark period of LD cycle. Colored bars at the top of graphs denote the feeding periods for TRF treatment groups, RF21-3 (blue) and RF9-15 (yellow).

