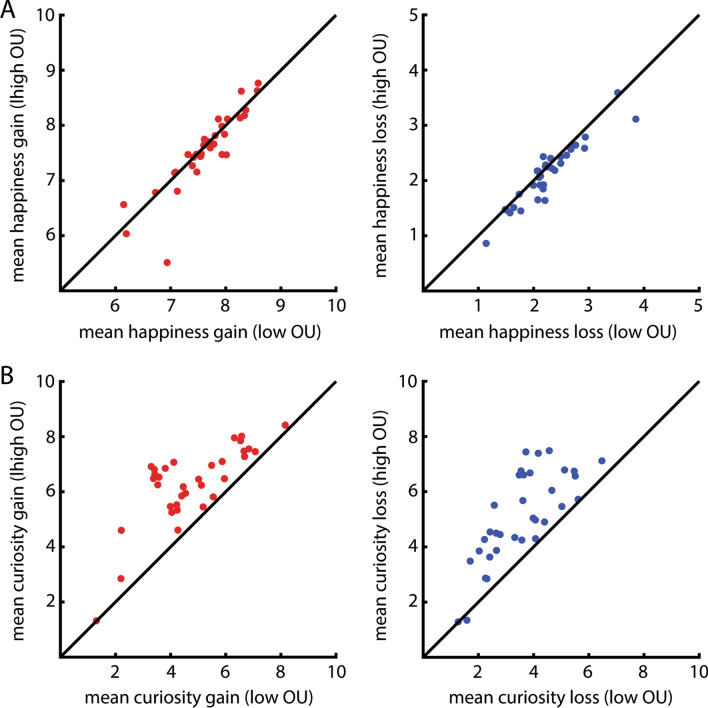
Figure 3.
Individual variability in the effects of outcome uncertainty on happiness (a) and curiosity (b). (A) Panel A depicts individual data points representing effects of outcome uncertainty on happiness, as a function of outcome valence (left: gains in red, right: losses in blue). In both graphs, the x-axis depicts mean happiness for low outcome uncertainty and the y-axis depicts mean happiness for high outcome uncertainty. Every dot depicts one participant. The majority of the dots are below the diagonal, indicating that participants were happier when lotteries with low compared with high outcome uncertainty were played. This effect was mainly present for the loss trials (blue, right graph) and to a lesser extent for the gain trials (red, left graph). (B) Panel B depicts individual data points representing effects of outcome uncertainty on curiosity, as a function of outcome valence (left: gains in red, right: losses in blue). Other conventions are as for panel A. In contrast with panel A, the majority of the dots are above the diagonal, indicating that participants are more curious about the outcome of lotteries with high compared with low outcome uncertainty. This was the case for gains (left, red) as well as for losses (right, blue).

