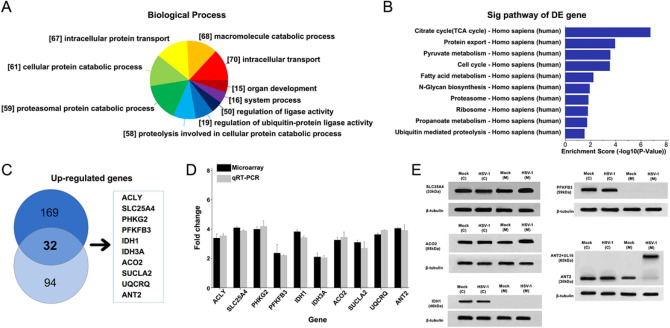
Figure 1.
Microarray data analysis and validation of array data by quantitative real-time PCR. HUVEC cells were infected with HSV-1 at an MOI of 5. After 24 h post-infection, compared to Mock cells, the HSV-1 mutant infected cells revealed the differentially expressed genes, especially upregulated genes, were classified into different functional categories according to Gene Ontology annotation. DESeq 3.4.4 (https://bioconductor.org/packages/release/bioc/html/DESeq.html), Endeavour 3.71 (http://homes.esat.kuleuven.be/~bioiuser/endeavour/endeavourweb.php), ToppGene (http://toppgene.cchmc.org). (A) Upregulated genes were described by biological process. (B) The differentially expressed genes were also analysed by KEGG Pathway. The top ten enrichment scores of upregulated pathways in HSV-1 infected cells. (C) Through the screening of differentially expressed genes in multiples of 2 times or more than 2 times, Venn diagram of the significantly upregulated genes in HSV-1 infected cells compared with Mock cells. (D) The qRT-PCR data were normalized to β-actin expression. Fold changes were determined by calculating the ratio of the mean expression values from the control and samples. Each value represents the mean of triplicates and barsindicate standard deviation. (E) Western blot of HSV-1 infected cells at 24 h, the differentially expressed proteins in cytoplasm and mitochondria. Mock as control group (empty plasmid transfection) (ImageQuant 350 software).

