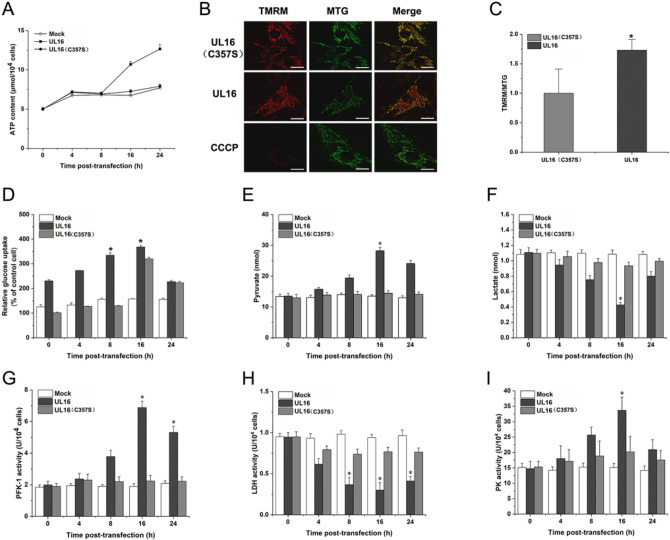
Figure 3.
Test for aerobic oxidation in HUVEC after UL16 transfection. (A) HUVEC cells was transfected with UL16, UL16 (C357S) and MOCK (empty plasmid), respectively. After transfection, HUVEC cells transfected with or without virus protein at moi0.5 were cultured for 24 h and then subjected to the measurement of ATP content. (B, C) Comparison of MMP between mock cells (upper) and UL16 transfected cells (lower). Data are the means ± SD of values from three fields containing more than 100 cells (bar.10 μm, *p < 0.05, **p < 0.01). (D) HUVEC cells were transfected with UL16, UL16 (C357S), mock (empty plasmid). At different times post-transfection, the supernatants were collected, and glucose consumption was measured. (E and F) The concentrations of pyruvate, and lactate were measured at different time points after transfected. (G, H and I) The monolayers from mock-, UL16 and UL16 (C357S) transfected HUVEC cells were cultured for 24 h and then PFK-1, LDH and PK activity were measured. These enzyme activities were measured by the corresponding enzyme activity detection kit at different time points after transfected. Each value represents the mean of triplicates and barsindicate standard deviation. *Represents a p value below 0.05, **represents a p value below 0.01 for comparisons between mock- and UL16, UL16 (C357S) transfected cells.

