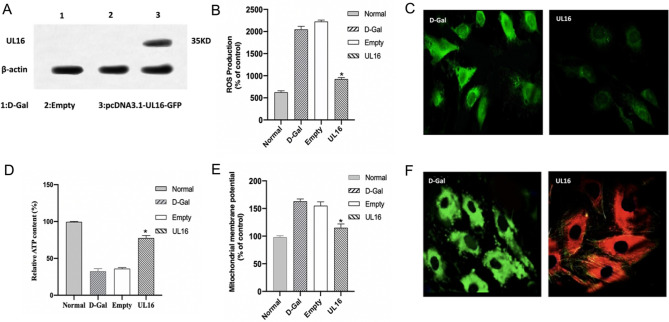
Figure 5.
The mitochondrial function test of the mitochondrial damage model induced by d-Gal after UL16 transfection. (A) It was verified that UL16 had been successfully transfected into the HUVEC cells induced by d-Gal. (B, C) The intracellular ROS level was detected in d-Gal group and UL16 group. (bar.50 μm, *p < 0.05, **p < 0.01). (D) UL16 was transfected into HUVEC cells induced by d-Gal, and then the content of ATP was measured in UL16 group, d-Gal group, Noraml group and Empty group. (E, F) The mitochondrial membrane potential of cells in d-Gal group and UL16 group was measured. electron microscope. (bar.20 μm, *p < 0.05, **p < 0.01).

