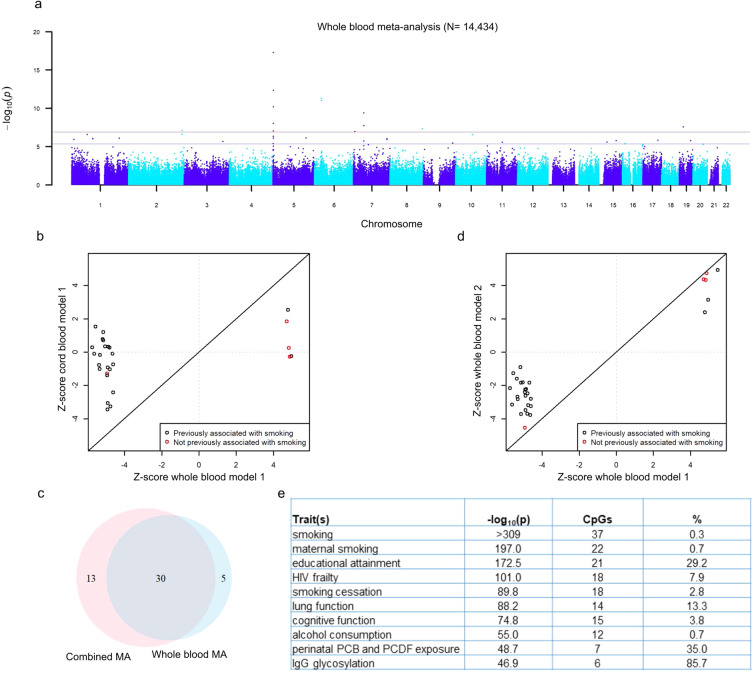
Fig. 1. DNA methylation associated with aggressive behavior in a large blood-based meta-analysis.
a Manhattan plot showing the fixed effects meta-analysis p values for the association between aggressive behavior and DNA methylation level based on the meta-analysis of peripheral blood. The blue horizontal line denotes the FDR-threshold (5%) and the red line indicates the Bonferroni threshold. b Effects sizes of top-sites from the meta-analysis of aggression in peripheral blood (x-axis) versus effects sizes from the meta-analysis of aggression in cord blood (y-axis). c Venn diagram showing the numbers and overlap of CpGs detected at FDR 5% in the meta-analysis of peripheral blood and the combined meta-analysis and cord blood and peripheral blood. d Effects sizes of top-sites from the meta-analysis of aggression in peripheral blood model 1 (x-axis) versus effects sizes from the meta-analysis of aggression in peripheral blood model 2; adjusted for smoking and BMI (y-axis). e Top enriched traits based on enrichment analysis with all 48 top-sites. The third column shows how many of the 48 CpGs have been previously associated with the trait in the first column. The last column shows the overlap as a percentage of the total number of CpGs previously associated with the trait in column 1 (e.g. 0.3% of all CpGs previously associated with smoking are also associated with aggression in the current meta-analysis). d In b and d, CpGs that have not been previously associated with smoking in the meta-analysis by Joehanes et al. [40] are plotted in red.

