Figure 4.
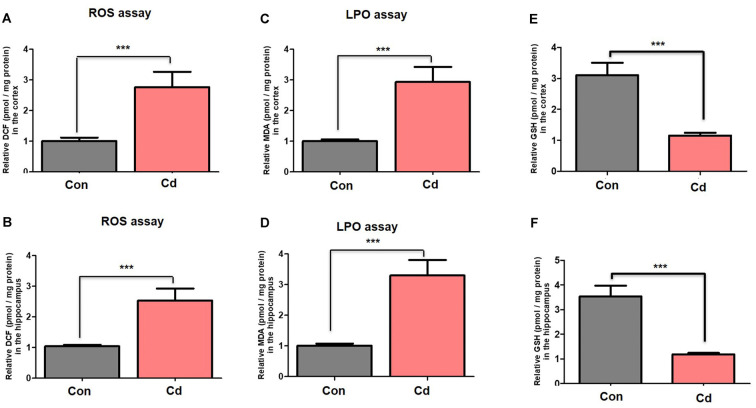
Chronic Cd exposure escalated oxidative stress/ROS accumulation. (A,B) Histograms indicated results of ROS assay in the cortical and hippocampal regions of the mouse brain. The results were represented as the means ± SEM (number = 7 mice/group) for three repeated independent and reproducible experiments. Significance = ***p < 0.001; Student’s unpaired t-test. (C,D) Histograms indicated results of LPO assay and MDA analyses in the cortical and hippocampal regions of the mouse brain. The results were represented as the means ± SEM (number = 7 mice/group) for three repeated independent and reproducible experiments. Significance = ***p < 0.001. Student’s unpaired t-test. (E,F) Histograms indicated results of GSH assay in the cortical and hippocampal regions of the mouse brain. The results were represented as the means ± SEM (number = 7 mice/group) for three repeated independent and reproducible experiments. Significance = ***p < 0.001; Student’s unpaired t-test.

