
FIGURE 7.
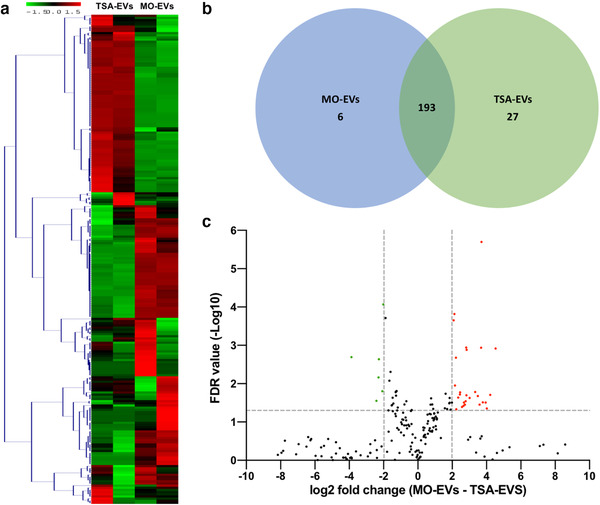
Differential expression of microRNAs derived from TSA‐EVs and MO‐EVs. a) Hierarchical clustering analysis of microRNAs that were differentially expressed between TSA‐EVs and MO‐EVs. b) Venn diagram comparing microRNAs differentially expressed from TSA‐EVs and MO‐EVs. A total of 193 shared microRNAs; 27 microRNAs upregulated in TSA‐EVs and 6 microRNAs upregulated in MO‐EVs. c) Volcano plot displaying Log2 values for the microRNAs fold‐change against Log10 FDR. MicroRNAs with a Log2 fold difference below 2 and a statistical value of > 0.05 were not considered to be statistically significant (vertical and horizontal lines respectively). The red points in the plot represents the significantly upregulated TSA‐EV microRNAs, the green points represent significantly upregulated MO‐EVs microRNAs