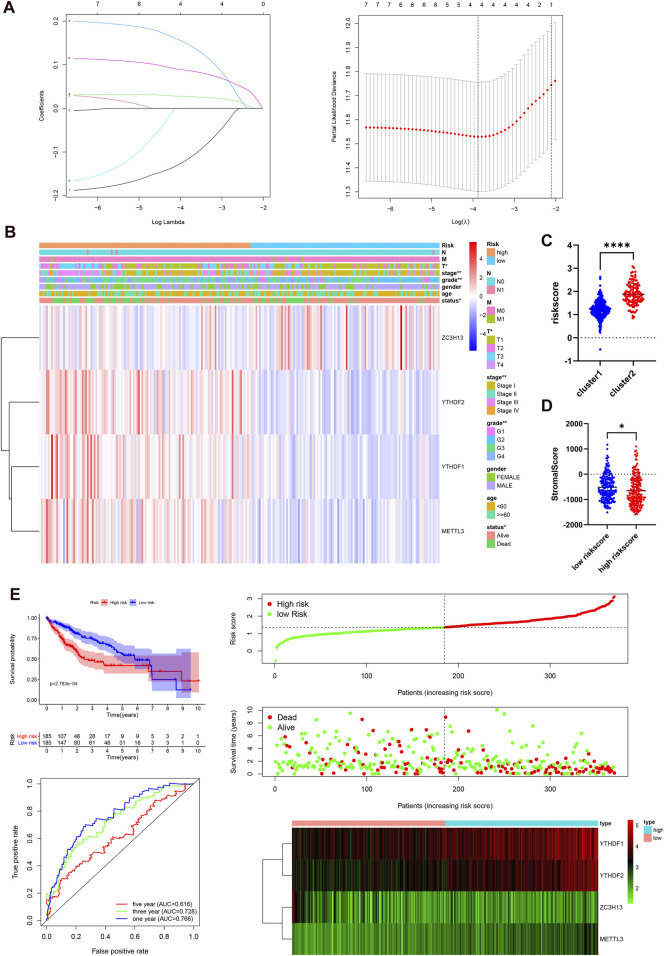
FIGURE 4.
Prognostic risk signatures correlated with clinicopathological characteristics in the TCGA-LIHC. (A), construction of the risk signature model. (B), heatmap and clinicopathological characteristics of two risk subgroups. (C), distribution of risk scores stratified by cluster. (D), the relationship between risk score and stromal score. (E), survival curve, ROC curve, and risk score analysis in the TCGA-LIHC cohort.

