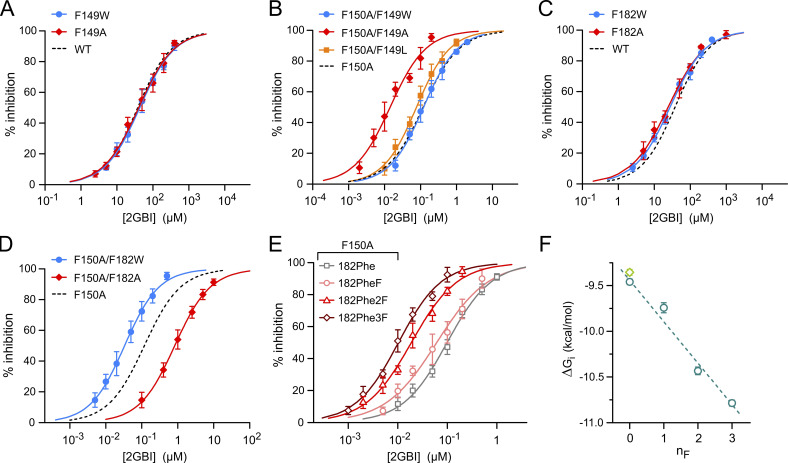
Figure 2.
Aromatic interactions stabilizing ligand binding in Hv1 F150A. (A and B) Concentration dependences of 2GBI-mediated inhibition of Hv1 WT (A) and F150A (B) with and without the indicated substitutions at position F149. (C and D) Concentration dependences of 2GBI-mediated inhibition of Hv1 WT (C) and F150A (D) with and without the indicated substitutions at position F182. Each data point in A–D is an average from three to nine independent measurements. Error bars are SD. (E) Concentration dependences of 2GBI-mediated inhibition of Hv1 F150A in which F182 is substituted with the indicated amino acids introduced via UAG suppressor tRNA. Each data point is an average from three to eight independent measurements. Curved lines represent fits of the data using Eq. 1. See Table S1 for fit parameters. (F) ΔGis measured from IC50s from E as a function of the nF in the Phe ring. Light-green diamond is the value for Hv1 WT. Error bars are SE. Dashed line is the linear fit of the data points in teal.

