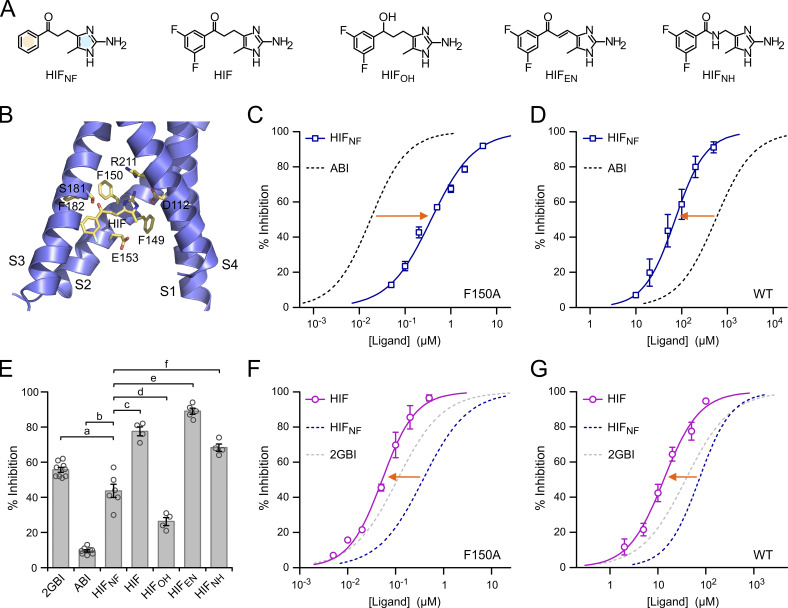
Figure 5.
Hv1 inhibition by HIF compounds. (A) Structures of HIF and related compounds. In HIFNF, the separate phenyl and 2-aminoimidazole rings are highlighted in yellow and blue, respectively. (B) Structural model of the VSD of human Hv1 in the activated conformation (from Geragotelis et al., 2020) interacting with HIF at the end of the MD simulation described in the Materials and methods section and showing residues in the vicinity of the ligand. (C and D) Concentration dependences of HIFNF-mediated inhibition of Hv1 F150A (C) and Hv1 WT (D) compared with ABI. Each data point represents the mean of three to seven independent measurements ±SD. Curved lines represent fits of the data using Eq. 1. See Table S1 for fit parameters. Orange arrows indicate that HIFNF is more effective than ABI at inhibiting Hv1 WT, whereas the situation is reversed for Hv1 F150A. (E) Inhibition of Hv1 WT by the indicated compounds tested at a concentration of 50 µM. Each bar is the mean of four to nine independent measurements. Error bars are SEM. A one-way ANOVA with Tukey’s post hoc test was used for statistical analysis. Comparisons between all pairs of inhibitors were statistically significant (P < 0.05), except for HIF/HIFNH (P > 0.05). For clarity, only comparisons with HIFNF are shown: p(a) = 1.4⋅10−3, p(b) < 1⋅10−9, p(c) = 6.4⋅10−8, p(d) = 1.2⋅10−4, p(e) = 1.0⋅10−9, p(f) = 3.3⋅10−7. (F and G) Concentration dependences of HIF-mediated inhibition of Hv1 F150A (F) and Hv1 WT (G) compared with HIFNF. Each data point represents the mean of three to five independent measurements ±SD. Curved lines represent fits of the data using Eq. 1. See Table S1 for fit parameters. Orange arrows indicate that fluorination of the phenyl ring increases the ligand apparent binding affinity to both Hv1 WT and F150A.

