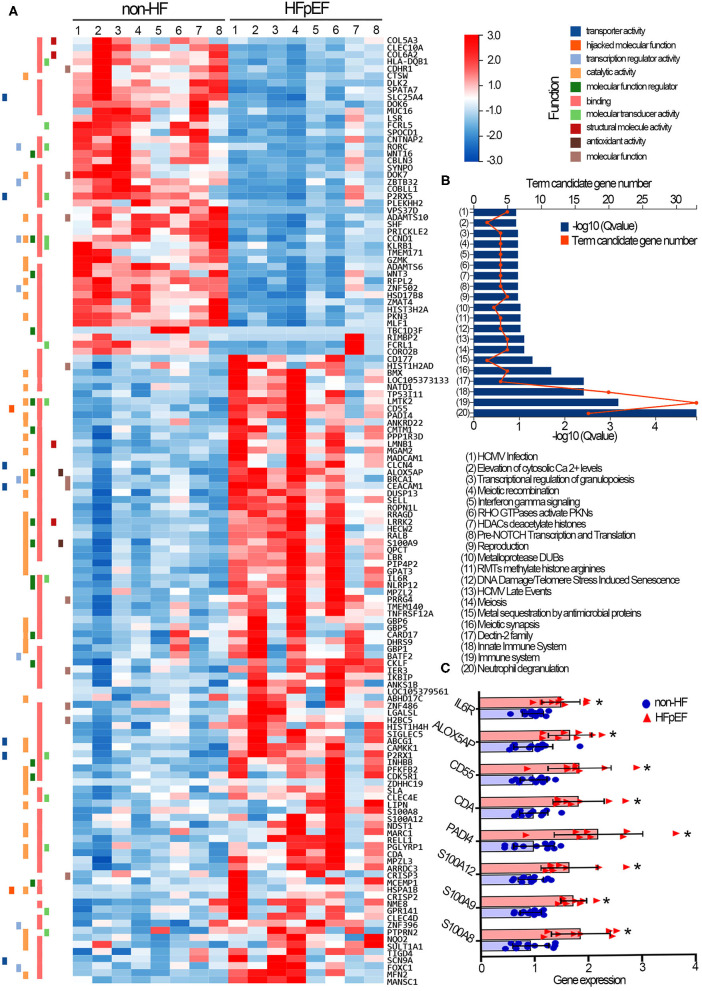
Figure 2.
Transcriptomic profile of circulating neutrophils collected from non-HF control individuals and HFpEF patients. (A) The representative heatmap of the 134 genes that were differentially expressed in neutrophils of non-HF control individuals and HFpEF patients. Red indicates relative gene up-regulation, and blue indicates relative gene down-regulation. (B) The Reactome enrichment analysis was performed to characterize signaling pathways that genes participate. (C) Gene expression levels of S100A8, S100A9, S100A12, PADI4, CDA, CD55, ALOX5AP, and IL6R were compared in neutrophils of two groups. Fold change was calculated for comparison and was presented with means and SD. *p < 0.05, compared with non-HF control individuals. Non-HF, non-heart failure controls (n = 12); HFpEF, heart failure with preserved ejection fraction (n = 8).

