Figure 1.
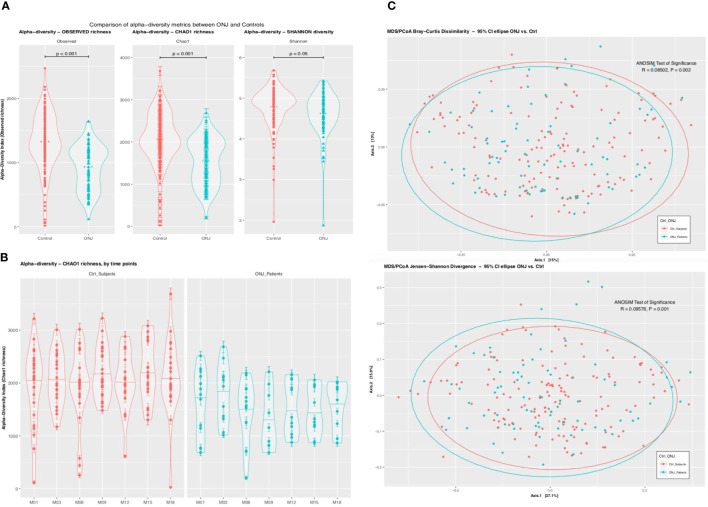
(A) Comparison of Alpha Diversity Metrics Between BRONJ and Control. Violin plots comparing the alpha-diversity metrics for richness (Observed and Chao1) and diversity (Shannon) between control (red) and BRONJ (blue). The graphs show significantly lower richness and diversity in BRONJ patients. The significance of difference was calculated using Kruskal-Wallis test with Conferroni correction. (B) Comparison of Alpha Diversity (Chao1 Richness) Between BRONJ and Control across study time points. (C) Principal coordinate analysis (PCoA) of oral cavity microbiota using Bray–Curtis dissimilarity matrix (top) and Jensen Shannon Divergence (bottom). Two-dimensional PCoA was used to describe the relative abundance of oral microbiota. Each point represents a single sample and is colored red for controls and blue for BRONJ.

