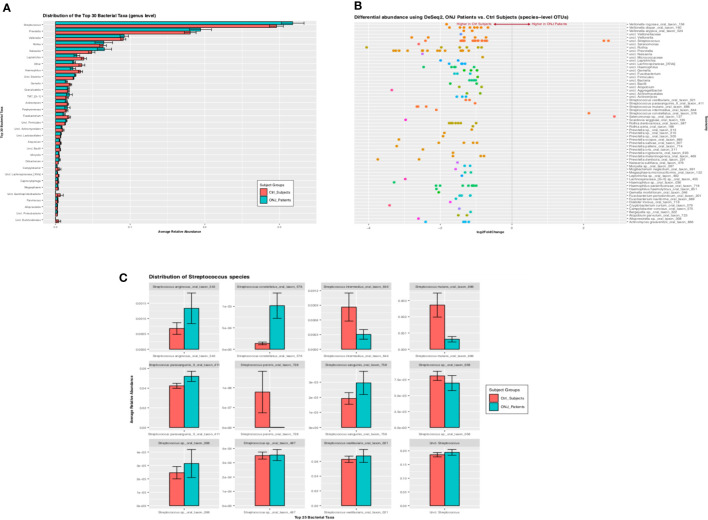
Figure 2.
(A) Bar graph showing the distribution of the 30 top bacterial taxa (assigned at the genus level) between BRONJ and controls. Relative abundance of three genera (Streptococcus, Prevotella, and Veillonela) is seen in both BRONJ and controls. (B) Differential Relative Abundance Analysis Using Deseq2. Pairwise comparison of the relative abundance of Operational Taxonomic Units (OTU) at species level; positive values of the Log2 fold change indicate higher relative abundance in BRONJ and negative values indicate higher relative abundance in control. (C) Distribution of Streptococcus species between Control (red) and BRONJ (blue).

