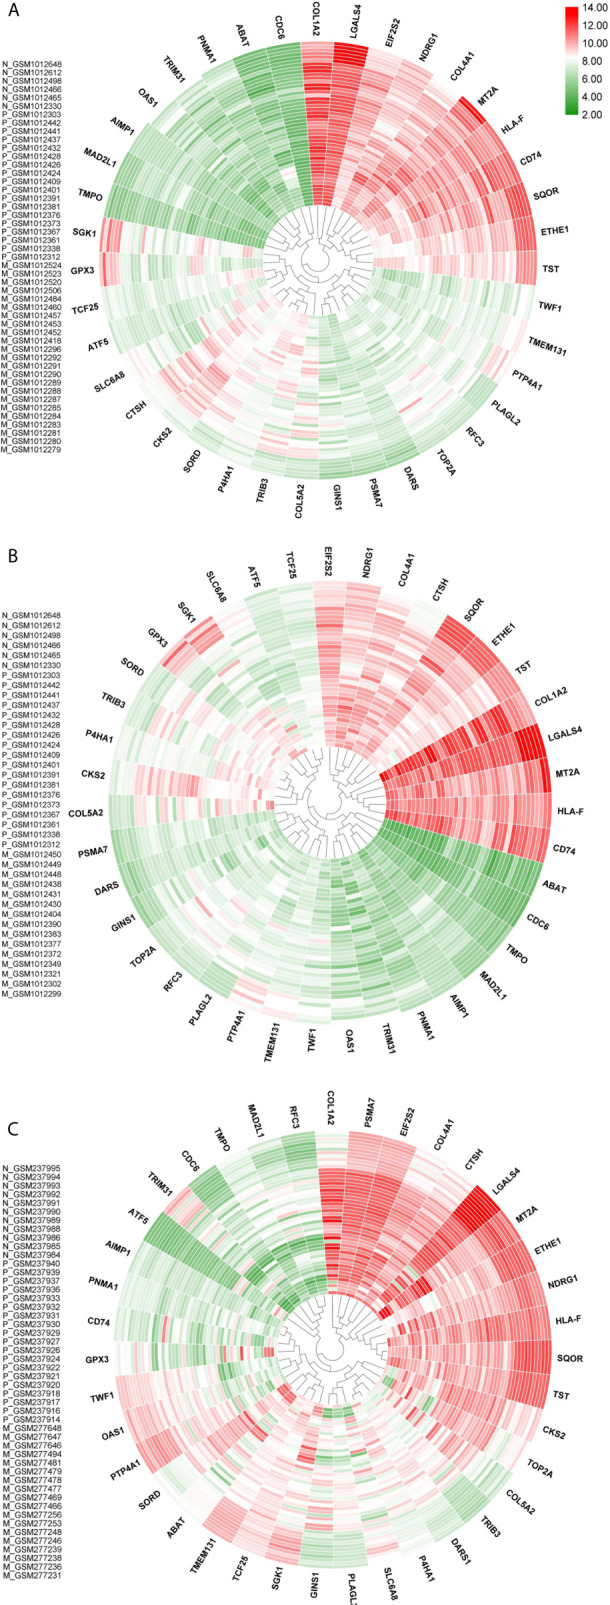
Figure 5.

Core network genes heatmaps. (A) is dataset1, (B) in dataset2 and (C) is dataset3. Values were obtained from expression matrices, Log2 transformed and normalized by quantile method. Sample IDs are placed in the left-hand side of each plot. Normal samples start with N, Primary samples start with P and liver and lung metastatic samples start with M. Outer samples are normal, middle samples are primary and inner samples are metastatic. Genes were clustered together based on hierarchical clustering.
