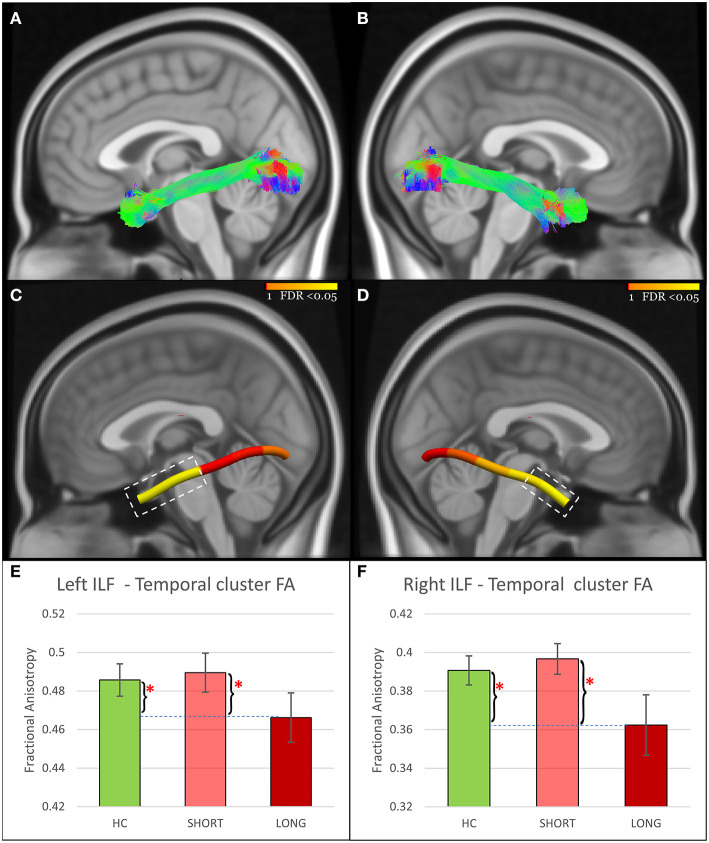
Figure 1.
ILF findings. (A,B) Show the reconstructed left and right ILF using TractSeg. (C,D) Show node clusters in the left and right ILF. The background is the standard MNI-152 1 mm brain. Red-Yellow color bar represents the range of p values used in node-wise statistics after FDR correction. Error-bar plots in (E,F) depict the group difference upon FA in the 42 HC (green color), 21 adolescents with short recovery (SHORT, light red color), and 21 adolescents with prolonged recovery (LONG, red color) after concussion. Braces and asterisks show p-values that survived FDR correction. ILF, Inferior Longitudinal Fasciculus; HC, healthy control; FA, Fractional Anisotropy; FDR, False Discovery Rate.

