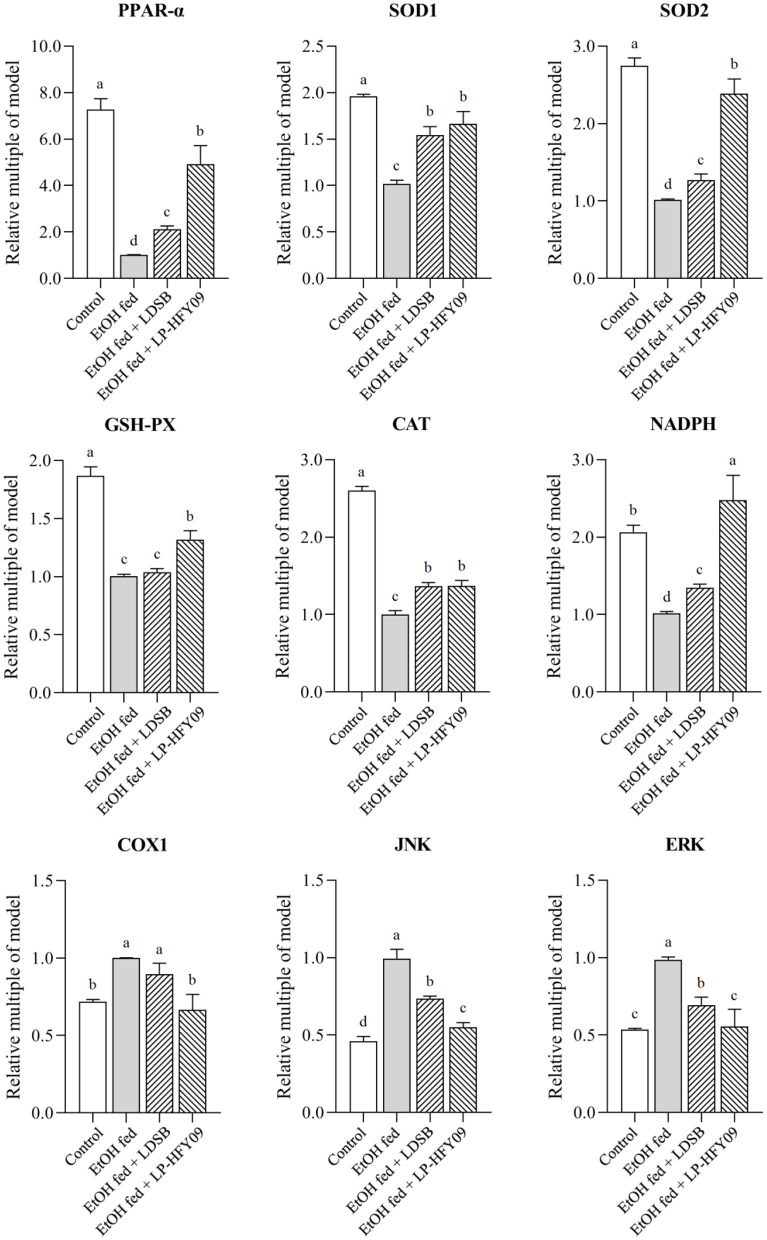
Figure 4.
mRNA expressions in hepatic tissue of mice; peroxisome proliferator-activated receptor alpha (PPAR-α), superoxide dismutase 1 (SOD1), superoxide dismutase 2 (SOD2), and glutathione-peroxidase (GSH-PX), catalase (CAT), nicotinamide adenine dinucleotide phosphate (NADPH), cyclooxygenase-1 (COX1), c-Jun N-terminal kinase (JNK), and extracellular regulated protein kinases (ERK). a−d The different letters mean that there are significant differences (p < 0.05) between every two groups, and the same letters mean that there is no significant difference (p > 0.05) between every two groups according to Duncan's multiple range test. Control, mice without treatment; EtOH fed, mice treated with 56° ethanol of 0.13 ml/10 g bw; EtOH fed + LDSB, mice treated with 1.0 × 10⁹ CFU/kg of Lactobacillus delbruechill subsp. bulgaricus before ethanol-treatment; EtOH fed + LP-HFY09, mice treated with 1.0 × 10⁹ CFU/kg of Lactobacillus plantarum HFY09 before ethanol-treatment.

