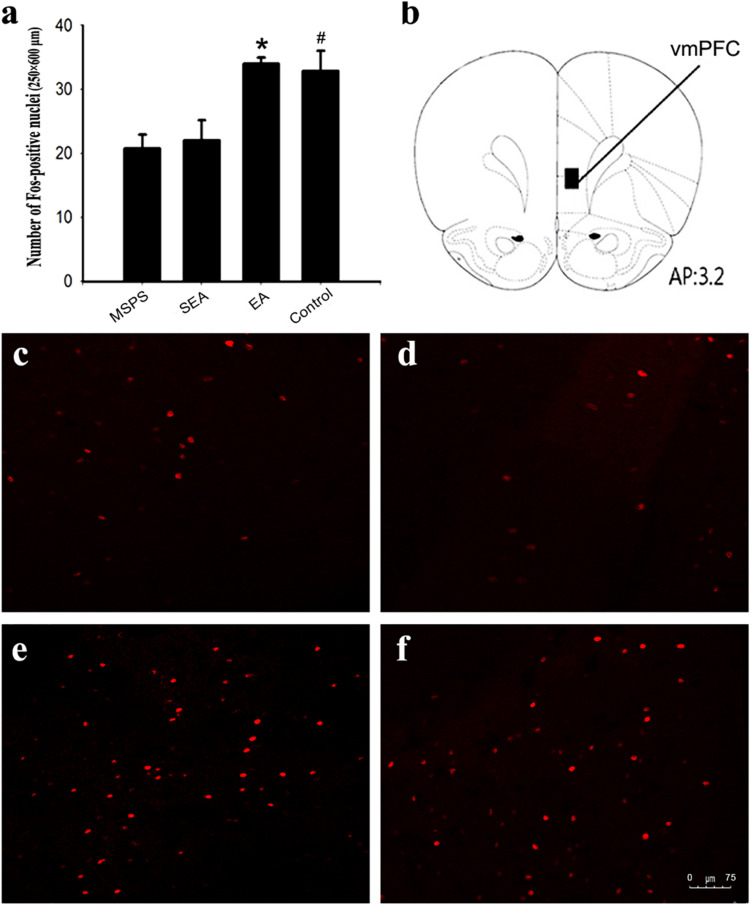
FIGURE 3.
EA treatment increases the number of Fos-positive nuclei in the vmPFC of MSPS model rats. (a) Quantitative assessment of Fos-positive nuclei in the vmPFC. Data are means ± SEM. *#P < 0.05 vs. PTSD group. (b) Schematic overview of a coronal section through the vmPFC, with a 200 μm × 500 μm rectangle highlighting the region of the vmPFC in which Fos-positive nuclei were counted. The number at the bottom of the schematic indicates the distance from the bregma in millimeters. This image was adapted from an atlas produced by Paxinos and Watson. (c–f) Representative coronal sections illustrating Fos staining in the vmPFC: (c) MSPS group; (d) SEA group; (e) EA group; (f) Control group.

