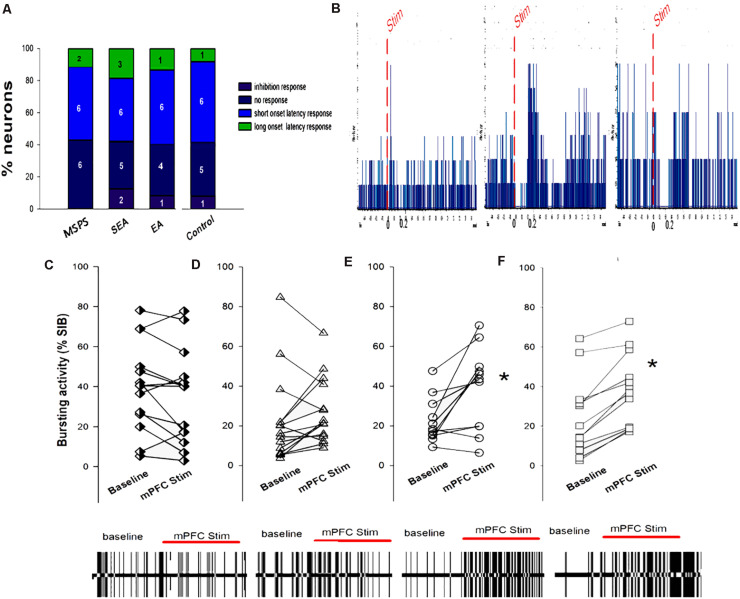
FIGURE 7.
The association between MSPS and EA treatment VTA DA neuron responses to vmPFC electrical stimulation. (A) VTA DA neuron response types in response to vmPFC stimulation in the indicated treatment groups. (B) Representative DA neuron short-latency excitatory responses (left), long-latency excitatory responses (middle), and inhibition responses (right) following vmPFC stimulation (50 pulses, 0.5 Hz). (C–F) VTA DA neuron bursting activity (%SIB) of VTA DA at baseline and upon vmPFC stimulation. (C) PTSD group; (D) SEA group; (E) EA group; (F) Control group. PTSD and SEA rats exhibiting no differences in %SIB between eight baseline and vmPFC stimulation, whereas %SIB rose relative to baseline upon vmPFC stimulation in EA and control rats. *P < 0.05, vs. baseline.

