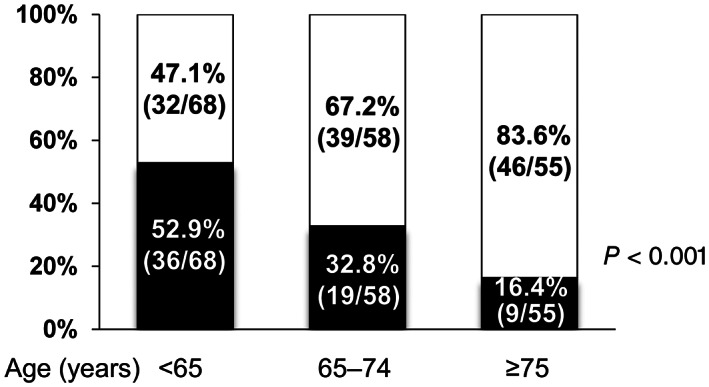
Figure 1.

The proportion of alcoholic liver cirrhosis (ALC) and non‐ALC among the three age groups (<65, 65–74, and ≥75 years). The proportion of ALC significantly decreased stepwise with advancing age, whereas the proportion of non‐ALC significantly increased (P < 0.001 by the Cochran–Armitage trend test). ( ), ALC; (
 ), non‐ALC.
