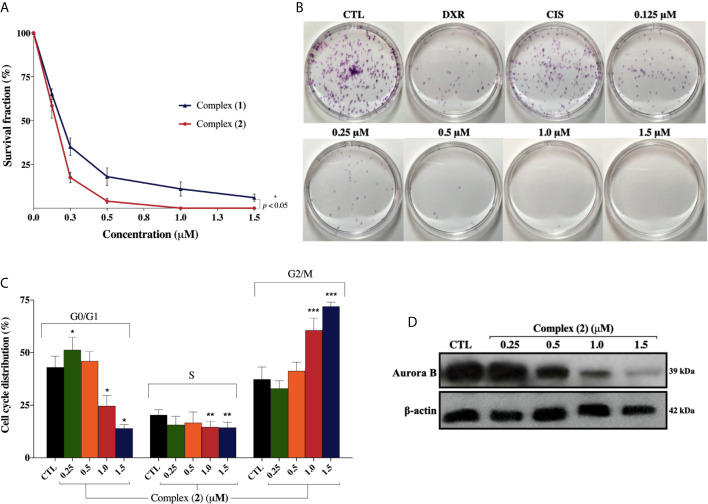
Figure 3.
Effect of lapachol-containing ruthenium complexes in DU-145 cell proliferation and cell cycle kinetics. (A) The survival fractions after 24h treatment with 0.125; 0.25; 0.5; 1.0, and 1.5 μM of complexes (1) and (2) against DU-145 cells. (B) Representative colony formation images of DU-145 cells after treatment with different concentrations of complex (2), DXR (2.5 μM) and CIS (25 μM). (C) Cell cycle distribution of DU-145 cells after treatment with complex (2) for 24 h. *, **, and *** indicate significant difference compared to the CTL in phase G0/G1, S, and G2/M, respectively. (D) Western blot analysis showing the expression status of Aurora-B in prostate adenocarcinoma cells after treatment with complex (2) for 24 h. The densitometric analysis of gray bands is shown in Supplementary Figure 11 . The negative control (CTL) was treated with the vehicle (DMSO 0.1% v/v) used for diluting the complex. Data are presented as the mean ± S.E.M. of three independent experiments performed in duplicate. Two-way ANOVA followed by Dunnett’s post-test (p < 0.05).

