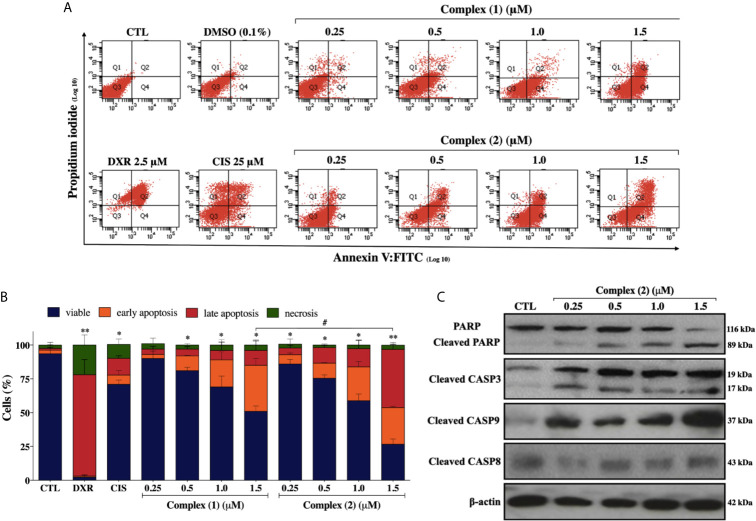
Figure 4.
Lapachol-containing ruthenium complexes induces apoptosis in DU-145 cells. (A) Representative flow cytometry dot plots show the presence of cells on viable (Q3), early apoptotic (Q4), late apoptotic (Q2) and necrotic (Q1) stages and, (B) showed the summary data determined by flow cytometry using annexin V-FITC/PI staining. Data are presented as the means ± S.E.M. of three independent experiments performed in triplicate. Ten thousand events were evaluated per experiment, and cellular debris was omitted from the analysis. (C) Western blot analysis showing the expression and activation status of cleaved PARP as well as cleaved caspase-3 and -9 levels in prostate adenocarcinoma cells after treatment with complex (2) for 24 h. The densitometric analysis of gray bands is shown in Supplementary Figure 11 . The negative control (CTL) was treated with the vehicle (0.1% DMSO) used for diluting the tested compound and, doxorubicin (DXR 2.5 μM) and cisplatin (CIS 25 μM) were used as drug control. Two-way ANOVA followed by Dunnett’s post-test where, *p < 0.05 vs. apoptotic cells in CTL; **p < 0.01 vs. apoptotic cells in CTL; # p < 0.05 apoptotic cells after 1.5 μM of complex (1) vs. apoptotic cells after 1.5 μM of complex (2).

