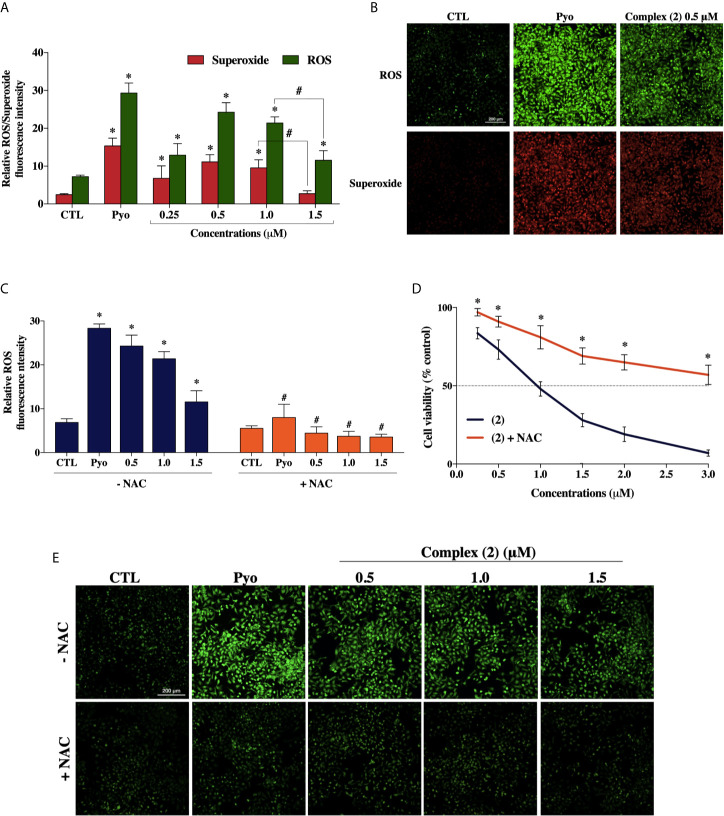
Figure 5.
Effect of the ruthenium complex (2) in the levels of reactive oxygen species (ROS) of DU-145 cells. (A) Quantitative analysis of relative ROS/Superoxide fluorescence emission intensity 24 h after incubation with different concentrations of complex (2). (B) Cells labeled with the ROS-sensitive fluorescent dyes using the Cellular ROS/Superoxide Detection Assay after exposure at 0.5 μM of the complex (2). (C) ROS levels of DU-145 cells after 24 h treatment with complex (2) at 0.5, 1.0, and 1.5 μM with or without the antioxidant NAC (5 mM). (D) Cell viability of DU-145 cells assessed by Alamar blue® assay after 24 h incubation with different concentrations of (2) with or without the antioxidant NAC (5 mM). (E) ROS scavenger NAC reduces the generation of intracellular ROS induced by complex (2). All fluorescence images were acquired using INCell Analyzer 2000 system at a total magnification of 200× (scale bar = 200 μm). The negative control (CTL) was treated with the vehicle (0.1% DMSO) used for diluting the tested compounds. Pyocyanin (Pyo, 250 μM) was used as the positive control. Data are presented as the mean ± S.E.M. of three independent experiments performed in triplicate or quadruplicate. *p < 0.05 compared with the control by ANOVA followed Dunnet’s test. # p < 0.05 compared with the respective treatment without NAC by ANOVA followed Dunnet’s test.

