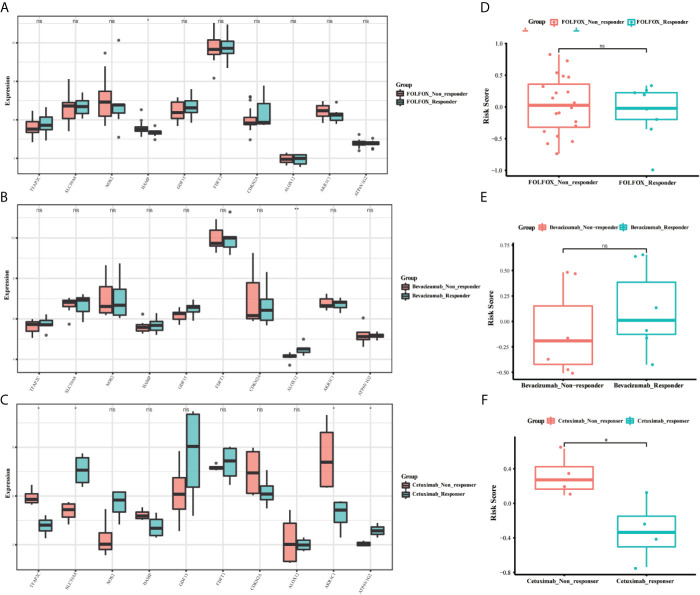
Figure 9.
The boxplots of the different expression levels of the 10 ferroptosis-related genes between the FOLFOX (A), Bevacizumab (B), and Cetuximab (C) responders and non-responders in the GSE19860, GSE19862 and GSE56386 datasets. The boxplots for the relationships between the risk scores and the drug resistance in the GSE19860 (D), GSE19862 (E) and GSE56386 (F) datasets. *p < 0.05, **p < 0.01. ns, no significance.

