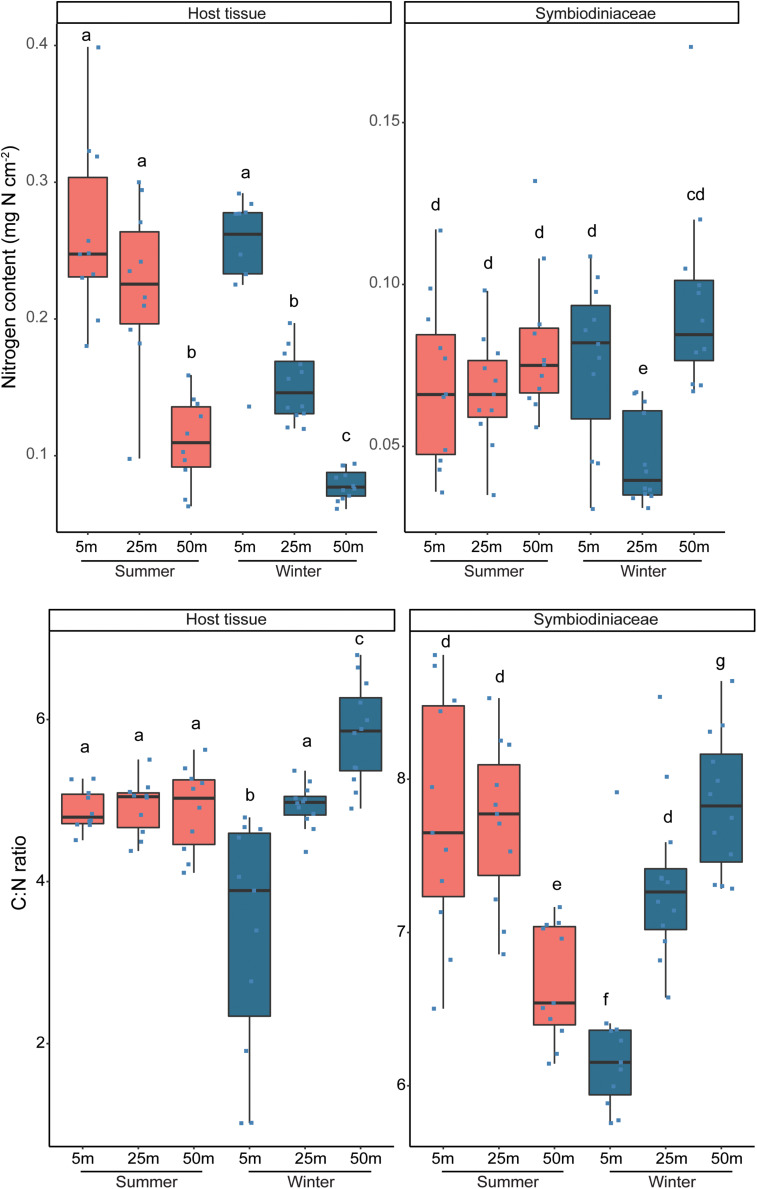
FIGURE 2.
Nitrogen content and atomic C:N ratios of host tissue and Symbiodiniaceae from Stylophora pistillata corals collected along a depth gradient (5, 25, and 50 m) in summer and winter. Different lettering (a–g) above the bars indicates significant differences between samples (Generalized Linear Models; significance level: p < 0.05). Note the different scaling of the y-axes between host tissue and Symbiodiniaceae.

