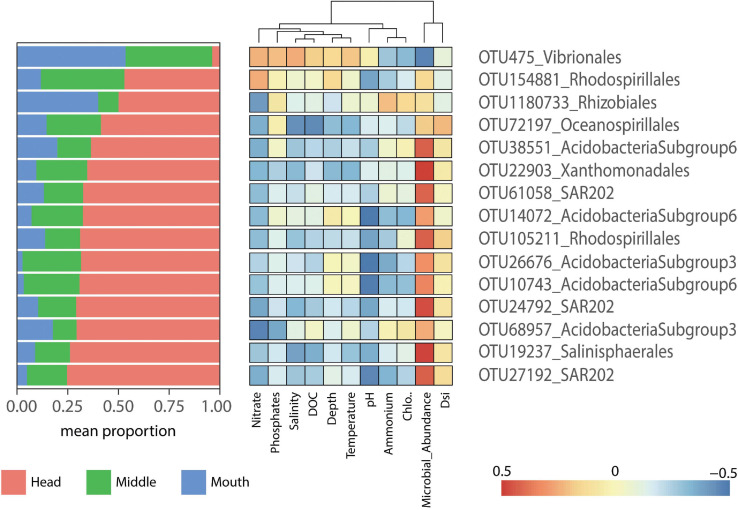
FIGURE 6.
Heatmap displaying the indicator species (p = 0.001) for the Pia fjord. The left panel shows the mean relative contribution of the indicator species to the microbial communities by station (head, middle, and mouth). The right panel shows a heatmap of Pearson correlations between indicator species (OTU abundance) and environmental factors.

