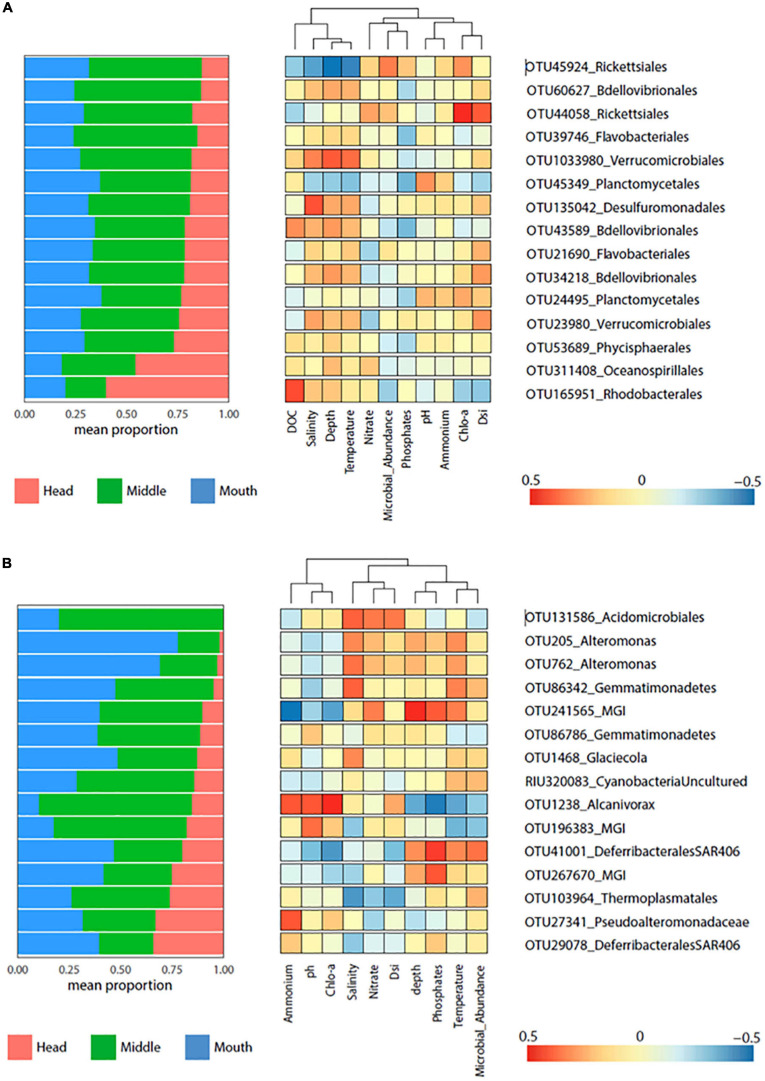
FIGURE 7.
Heatmap displaying the indicator species (p = 0.001) for Yendegaia fjord 2017 (A) and 2018 (B). Left panel shows the mean relative contribution of the indicator species to microbial community detected by stations (head, middle, and mouth). Right panel shows heatmap of Pearson correlation between indicator species (OTU abundance) and environmental factors.

