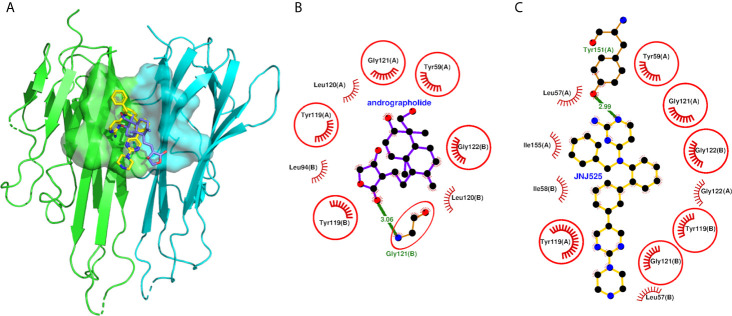
Figure 5.
Molecular docking of andrographolide with human TNF homodimer. (A) The pose of andrographolide within the binding site of TNF homodimer. The NFkB1 is shown in cartoon representation colored green (Chain A) and cyan (Chain B) with the binding site in surface representation. The andrographolide and the native inhibitor are shown as sticks colored blue and yellow, respectively, with red oxygen and blue nitrogen atoms. (B, C) Protein-ligand interaction plots of andrographolide and the native inhibitor JNJ525 with TNF homodimer. The andrographolide and hydrogen bonding residue are shown in ball and sticks representation, with balls representing atoms and sticks representing the bond between two atoms. The color of balls distinguishes among atom types as C-atom in black, O-atoms in red, and N-atoms in blue colors. The non-bonded interactions labeled with interacting residue are shown as red arcs with bristles, while the hydrogen bond is shown as a green line labeled with bond length in Å. The residues common among interacting residues of both the native inhibitor and the andrographolide are encircled.

