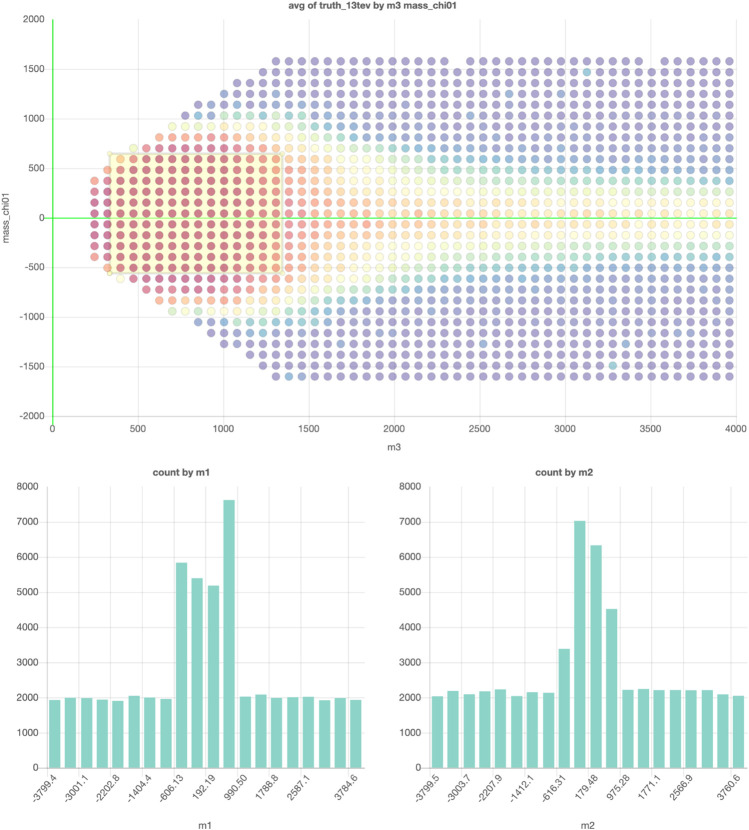
FIGURE 4.
The example projection made of a subset of the data in ATLAS collaboration (2015). The graph on top shows the projection on two of the 19 free parameters and the colors indicate the average exclusion for the model configurations in each for the bins. The two graphs on the bottom can be used to make cuts on two of the remaining 17 parameters. Interactive dashboard of these graphs can be accessed here.

