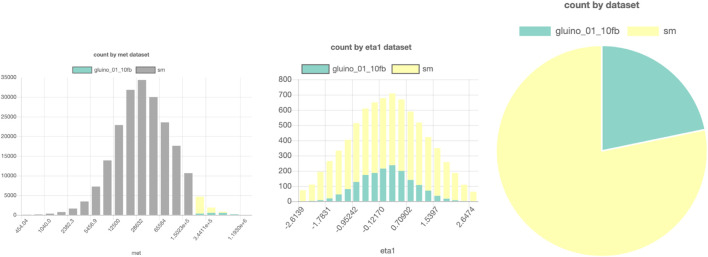
FIGURE 7.
SPOT-based comparison of a possible LHC signal (here, a gluino production from supersymmetry) and background. Parts of a figure can be turned off to filter them out in the other figures. In this example, the gray bars in the left histogram are turned off, so in the middle and right figures, only the data points with high MET are shown. The interactive dashboard of this dataset can be accessed here.

