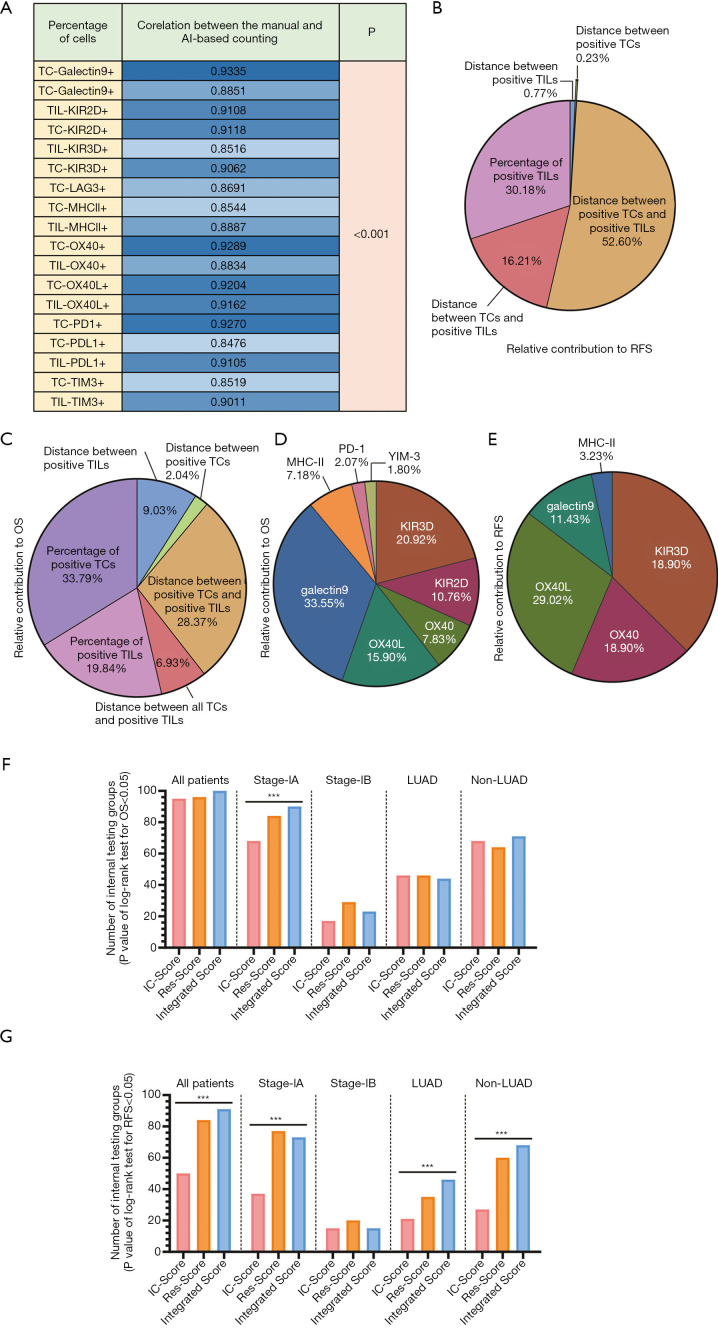
Figure 3.
The composition and function analysis of IC-Score, Res-Score, and integrated score. (A) The correlation coefficient (R value) between the manual and AI-based counting via the Spearman correlation test. The relative contribution of each quantitative and spatial classification in the IC-Score for OS (B) and RFS (C) is based on all internal testing groups'’ mean coefficient. The relative contribution of each immune checkpoint in the IC-Score for OS (D) and RFS (E) is based on all internal testing groups'’ mean coefficient. The number of internal testing groups with a P- value <0.05 in the log-rank test for OS (F) and RFS (G). ***P<0.001. From left to right are sub-group analysis in all patients, stage-IA disease, stage-IB disease, LUAD, and non-LUAD. TC, tumor cell; TIL, tumor-infiltrating lymphocyte; KIR2D, killer cell immunoglobulin-like receptor-2D; KIR-3D, killer cell immunoglobulin-like receptor-3D; TIM-3, T cell immunoglobulin-3; LAG-3, lymphocyte activation gene-3; PD-1, programmed cell death receptor-1; PD-L1, programmed cell death ligand-1; MHC-II, major histocompatibility complex class II; OX40L, OX40-ligand; OS, overall survival; RFS, relapse-free survival.

