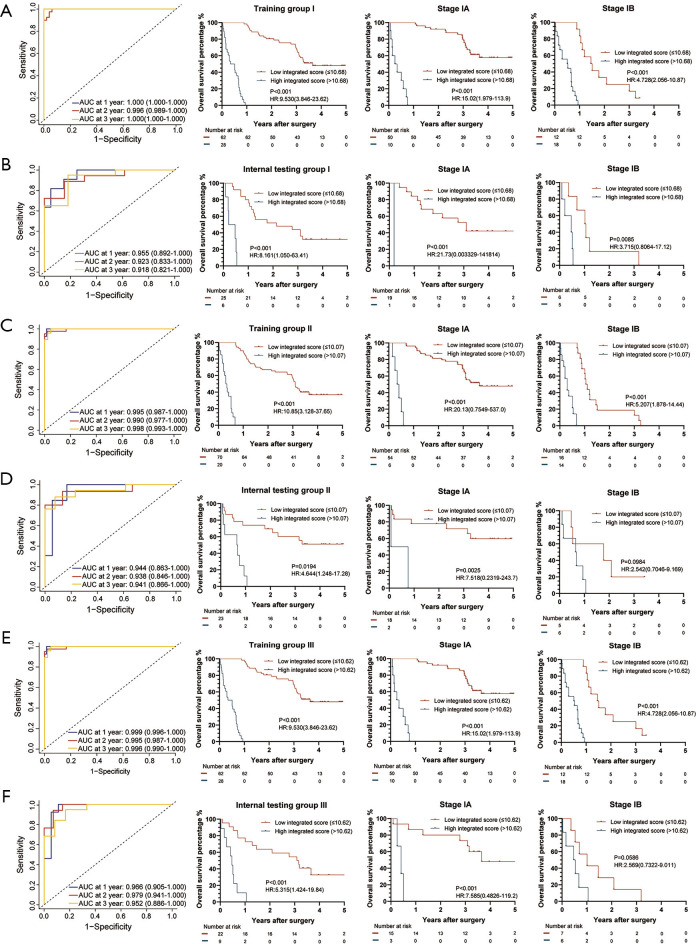
Figure 6.
The integrated score for OS measured by time-dependent ROC curves and Kaplan-Meier survival in the representative 3 training and internal testing groups. (A) Training group I; (B) internal testing group I; (C) training group II; (D) internal testing group II; (E) training group III; (F) internal testing group III. We used AUCs at 1, 2, and 3 years to assess prognostic accuracy of OS, and calculated P values using the log-rank test. Data represent AUC or P value. HR, hazard ratio; AUC, area under ROC; ROC, receiver operator characteristic. The cut-off point was determined by the X-Tile software, and the time-dependent AUC with 95% CI was calculated by the “timeROC” package of R software.

