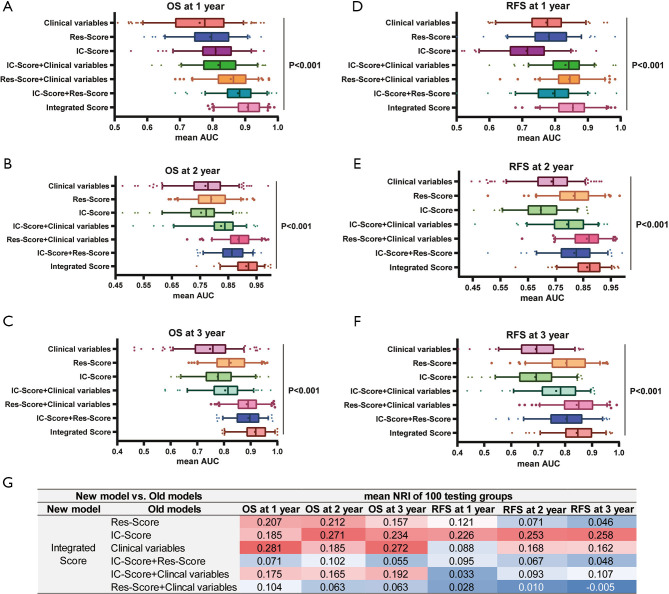
Figure 7.
The performance evaluation of all prognostic models. The predictive accuracy for 1-year OS (A), 2-year OS (B), 3-year OS (C), 1-year RFS (D), 2-year RFS (E), and 3-year RFS (F) based on the AUC with 100× bootstrap resampling for each model is shown in a box plot. Median values of 100× bootstrap resampling are shown with thick lines, and the mean values are shown by dots in the boxes. The mean NRIs of the comparison between the integrated-score and the rest models based on 100× bootstrap resampling is presented in table (G). OS, overall survival; RFS, relapse-free survival; IC-Score, immune checkpoint score; Res-Score, ResNet score; AUC, AUC, area under the receiver operating characteristic curve.

