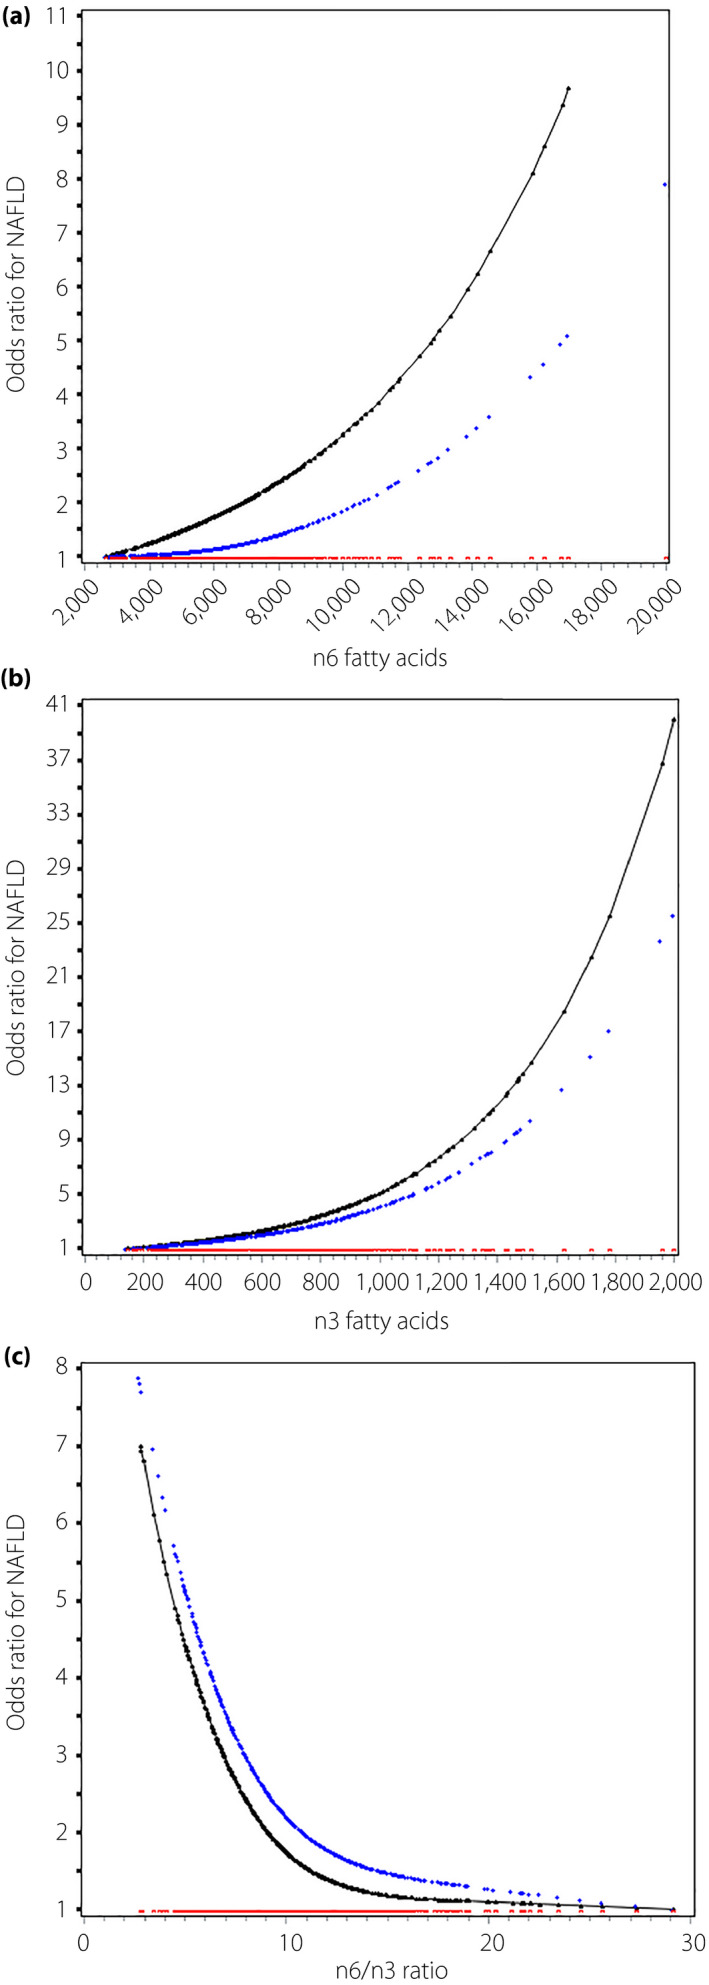
Figure 1.

Odds ratio curves of polyunsaturated fatty acids for non‐alcoholic fatty liver disease (NAFLD) risk in type 2 diabetes patients. (a–c) The relationships between n6, n3 fatty acids and the n6 : n3 ratio with NAFLD risk, respectively. The black curve was derived from univariable analysis, and the blue curve derived from multivariable analysis that adjusted for age, sex, glycated hemoglobin, systolic blood pressure, duration of diabetes, hypoglycemic drugs and lipid‐lowering drugs. The red curve represents the reference level (i.e., the odds ratio for type 2 diabetes mellitus was 1).
