
Figure 2.
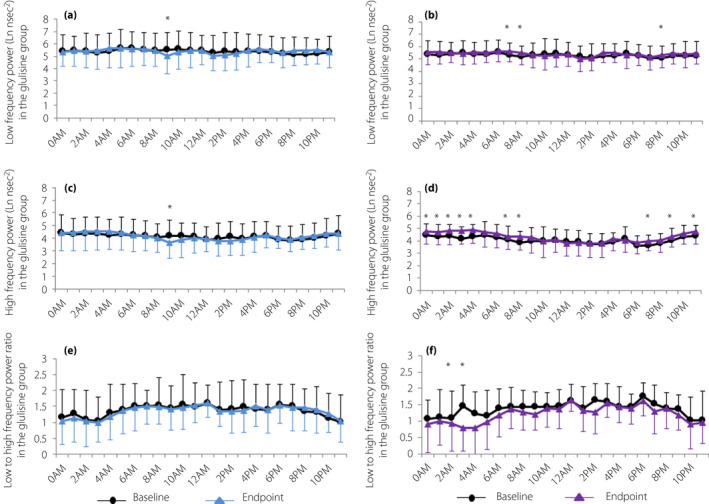
Cardiac autonomic nerve function. Diurnal variations in low‐frequency power at baseline and end‐point in the (a) glulisine group and (b) insulin glargine group. Diurnal variations in high‐frequency power at baseline and end‐point in the (c) glulisine group and (d) insulin glargine group. Diurnal variations in low‐ to high‐frequency power ratio at baseline and end‐point in the (e) glulisine group and (f) insulin glargine group. Data are expressed as the mean ± standard deviation. *P < 0.05 for comparisons between baseline and end‐point.