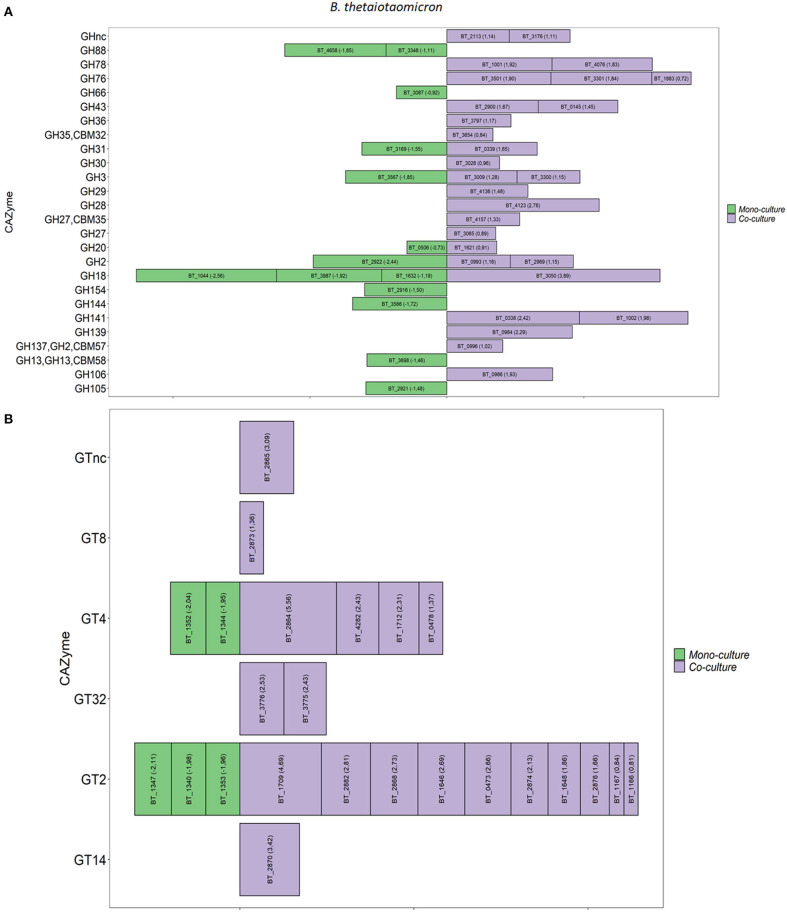
Figure 2.
Differential expression of GHs and GTs between mono and co-culture during in vitro fermentation. (A) B. thetaiotaomicron GHs, (B) B. thetaiotaomicron GTs. Only the CAZymes with adjusted p < 0.05 and Log2 Fold Change ≥ 0.58 are shown as averages. The size of each bar is proportional to the Log2 Fold change (the number between brackets within each bar).

