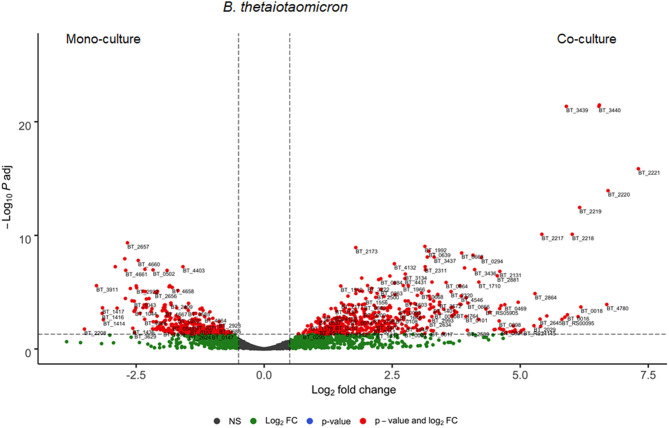
Figure 3.
Differential expressed genes of B. thetaiotaomicron between mono- and co-culture during in vitro fermentation. Volcano plot of the differential expressed B. thetaiotaomicron genes of mono- vs. co-culture. Positive Log2 fold change indicates upregulation in co-culture. The horizontal dashed black line adjusted p-value threshold (q-value = 0.05). The vertical dashed black lines indicate Log2 fold change threshold (Log2 fold change = 0.58).

