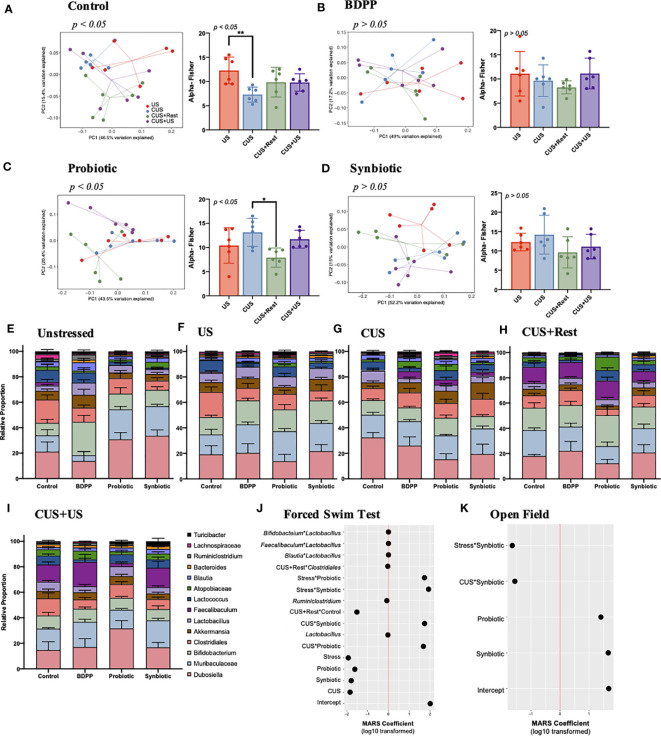
Figure 3.
Chronic and recurrent stress induced variations in the gut microbiota in response to synbiotic treatment. 16S V4 metagenomic sequencing of the gut microbiota following chronic and recurrent stress and treatment with variations in genera across all timepoints in the CUS protocol: US, CUS, CUS+Rest and CUS+US. Variation in community structure was assessed with permutational multivariate analyses of variance (PERMANOVA) between groups (beta diversity) with visualization of the data using Principal Coordinates Analysis (PCoA) with the lines representing the distance of each individual to the centroid. The alpha diversity calculated as the Fisher’s Alpha test following (A) stressed vehicle control, and stress with (B) BDPP, (C) Probiotic and (D) Synbiotic. Statistical significance is marked by *p < 0.05 and **p < 0.01. Variations in the gut microbiota over time, within treatment group can be found in Figure S3 . Variations in the 14 most abundant genera with respect to treatment is shown in (E) unstressed vehicle controls, (F) US, (G) CUS, (H) CUS+Rest and (I) CUS+US with statistical differences outlined in Figure S4 . Results from the MARS algorithm show the interactions of gut microbiome and study covariates predicting (J) forced swim test and (K) open field test. The x-axis depicts the signed log10 transformed absolute value of the term coefficient in the MARS model. Note that the hinge function was removed for simplicity of visualization. Each group contains n = 6 mice (the same mice used for RNA/protein studies) +/- SEM individuals while significance determined with one-way ANOVA with Tukey’s posthoc analysis. Statistics for the β-diversity is as outlined in material and methods section.

