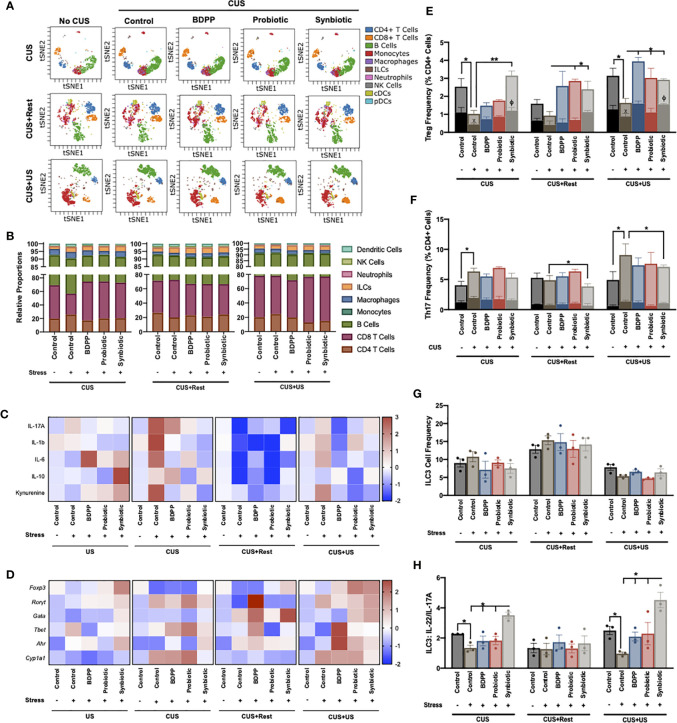
Figure 4.
Synbiotic alleviates ileal immune variations in response to chronic and recurrent stress. Immunophenotyping of the ileum was determined with a CyTOF panel and (A) overall visualization of the similarity of major cell populations in a single representative sample is depicted as a viSNE plot. The viSNE plot is two-dimensional figure with the axes tSNE1 and tSNE2, with cells plotted on a continuum of expression with phenotypically related cells clustered together based on gating of major cell populations and colored based on cell type called a “phenotypic island”. Quantification of each of these cell populations (n =3) is shown in (B). Overall immunological response is depicted as a heatmap of the (C) cytokine and (D) transcriptional profiles (n = 6) and represented as the ratio of relative values of stressed vs. non-stressed for the respective group normalized with the z-score across all timepoints for a single gene or cytokine. A positive z-score is represented with red and a negative z-score with blue. Individual cell frequencies of (E) regulatory T cells (Tregs) and (F) T helper (Th) 17 cells relative to total CD4+ cell populations are shown with a solid color inset of activated Treg (CTLA+) and Th17 (IL17A+ICOS+) cells, respectively. Frequency of (G) innate lymphoid cell (ILC)3 relative to total cell populations and (H) the ratio of IL-22 to IL-17A producing ILC3 cells are shown. All cell frequencies represent n = 3 mice +/- SEM with significance determined with a one-way ANOVA and Tukey’s post-hoc analysis where *p < 0.05, **p < 0.01.

