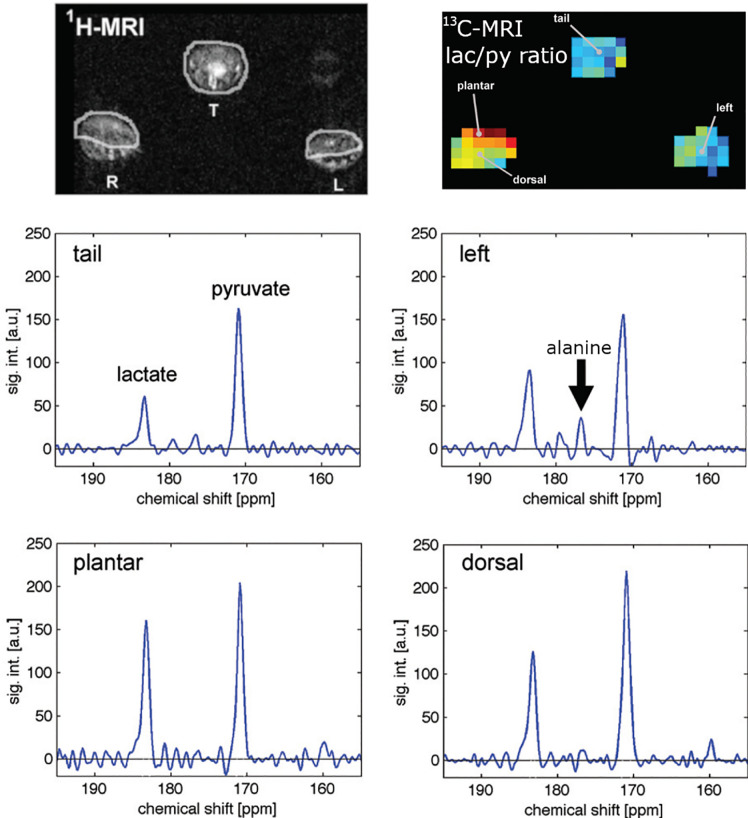
Figure 4.
Measuring the metabolism of an arthritis model with hyperpolarized hyperpolarized MRI: anatomical 1H MRI (top left), quantitative metabolic map of lactate-to-pyruvate ratio (top right) and corresponding 13C spectra. Arthritis was induced in the right paw of the rats while the left served as a control. Hyperpolarized pyruvate was injected and 13C metabolic imaging performed. The inflamed paw exhibited a 65% increase in lactate signal and no alanine signal indicating abnormal metabolism. Figure modified from [MacKenzie et al. (79)].

