FIGURE 6.
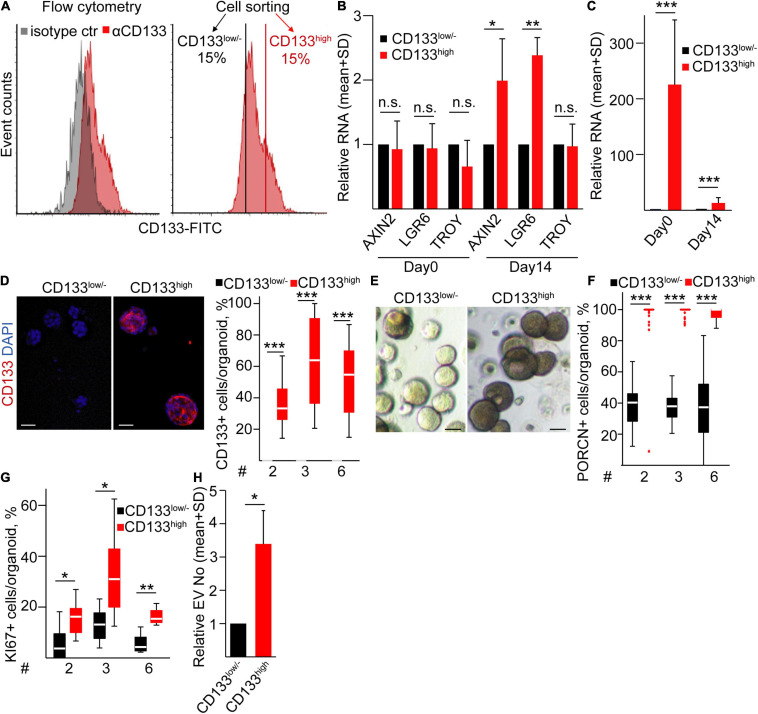
CD133high LUAD cells produce organoids with a high proliferation rate and EV release. (A) CD133 expression on LUAD organoid cells and the strategy for sorting CD133high and CD133low/– cells (flow cytometry and cell sorting). (B) Relative RNAs for AXIN2, LGR6, and TROY from freshly sorted cells (day 0) or from organoids initiated by CD133high or CD133low/– cells, measured on day 14 (RT-qPCR, n = 4). Data were normalized to HPRT1 housekeeping, and RNA levels of the CD133high population were then compared to the CD133low/– results in each sorting experiment. (C) Relative RNA level of CD133 from the sorted cells (day 0) and organoids initiated by these cells (day 14). Normalized RNA level from the CD133low/– population was taken one (RT-qPCR, n = 4). (D) Immunostaining for CD133 and the quantification of confocal microscopic images in organoids derived from sorted cells (CD133low/– or CD133high) on day 14 (n = 3). (E) Bright-field microscopic images of organoids initiated by the indicated sorted LUAD cell populations. (F,G) Percentage of PORCN + (F) and KI67+ (G) cells in the organoids derived from sorted CD133low/– and CD133high cells on day 14. (H) Relative EV number from CD133low/– or CD133high cell-derived organoids on day 14 (NTA, n = 4). Data were normalized to 106 cells before comparisons. Data for three LUAD samples are shown in panels (D,F,G) with 10–15 images analyzed from three replicates. One-sample t-test (B,C,H) or Mann–Whitney U-test (D,F,G) were used with *p < 0.05, **p < 0.01, and ***p < 0.005. Scale bars: 50 μm.

