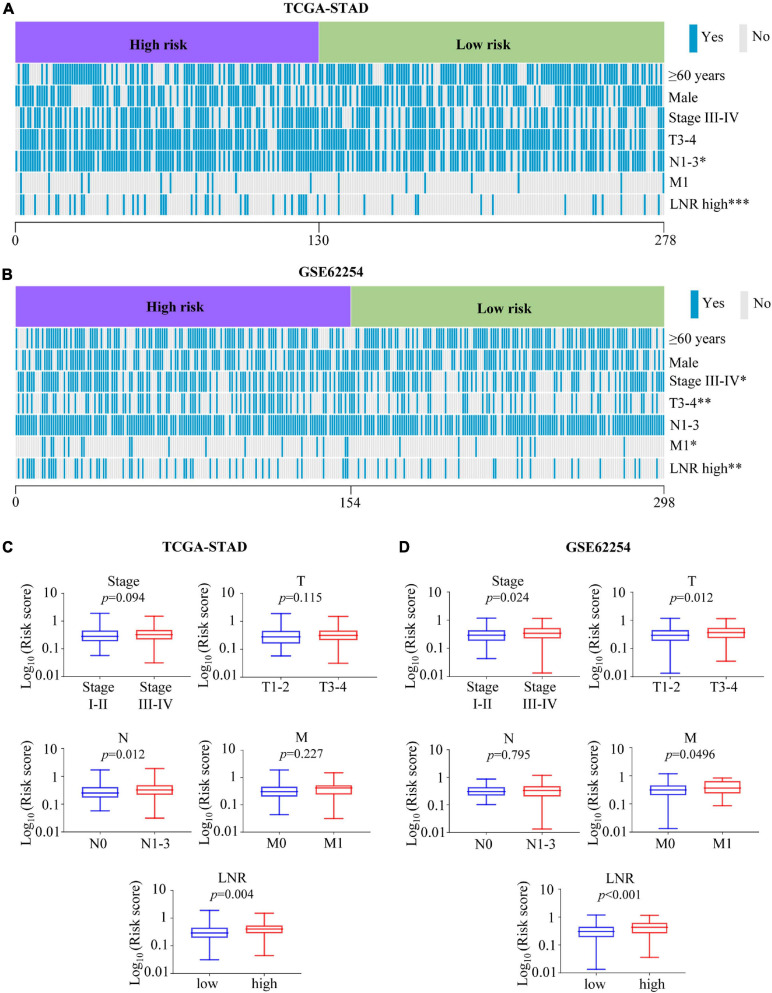
FIGURE 4.
Association between the risk score with clinical characteristics. (A,B) Heatmaps of association between the risk score with clinical characteristics in the TCGA-STAD (A) and GSE62254 (B) cohorts. (C,D) Comparisons of risk score among different clinical subgroups stratified based on stage, T, N, M, and LNR in the TCGA-STAD (C) cohort and GSE62254 (D) cohort. ∗p < 0.05, ∗∗p < 0.01, ∗∗∗p < 0.001.

