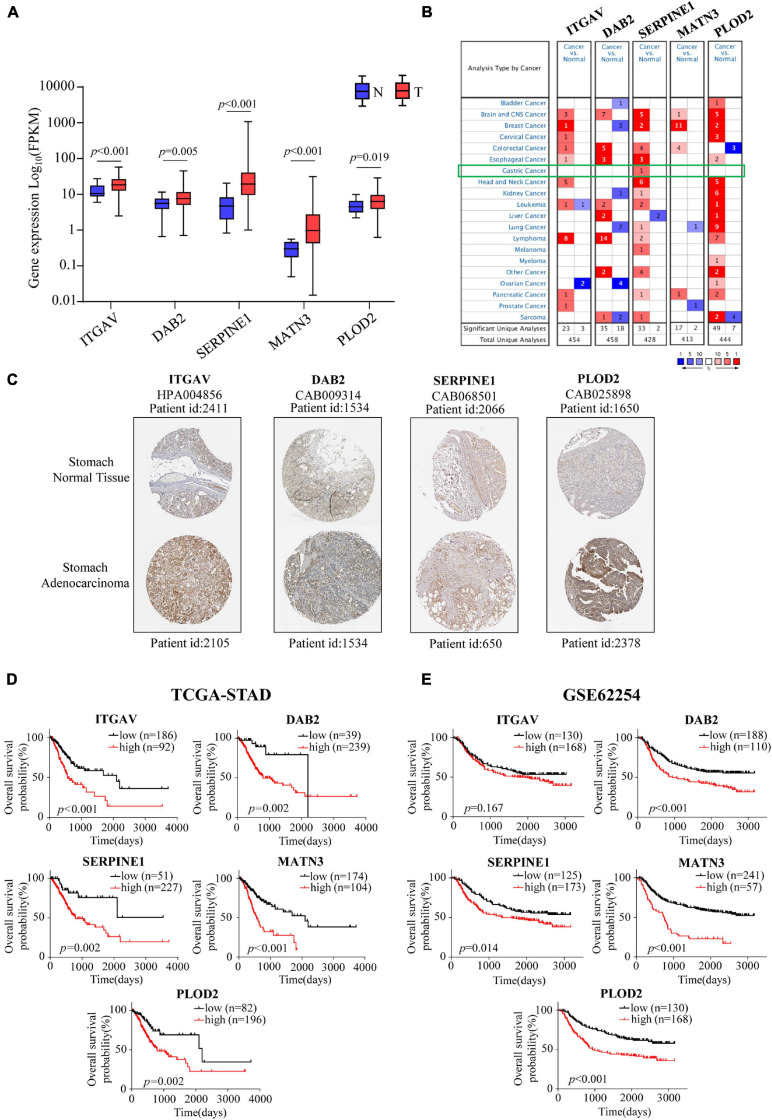
FIGURE 5.
Expression profiles, Kaplan-Meier analyses of EMT-related signature members. (A) The mRNA expression profiles of members in EMT-related signature in the TCGA-STAD cohort. (B) Expression profiles of EMT-related signature members in Oncomine database. (C) The protein expression profiles of EMT-related signature members in the Human Protein Atlas database. (D,E) Kaplan-Meier estimates of OS based on EMT-related signature members in the TCGA-STAD cohort (D) and the GSE62254 cohort (E).

