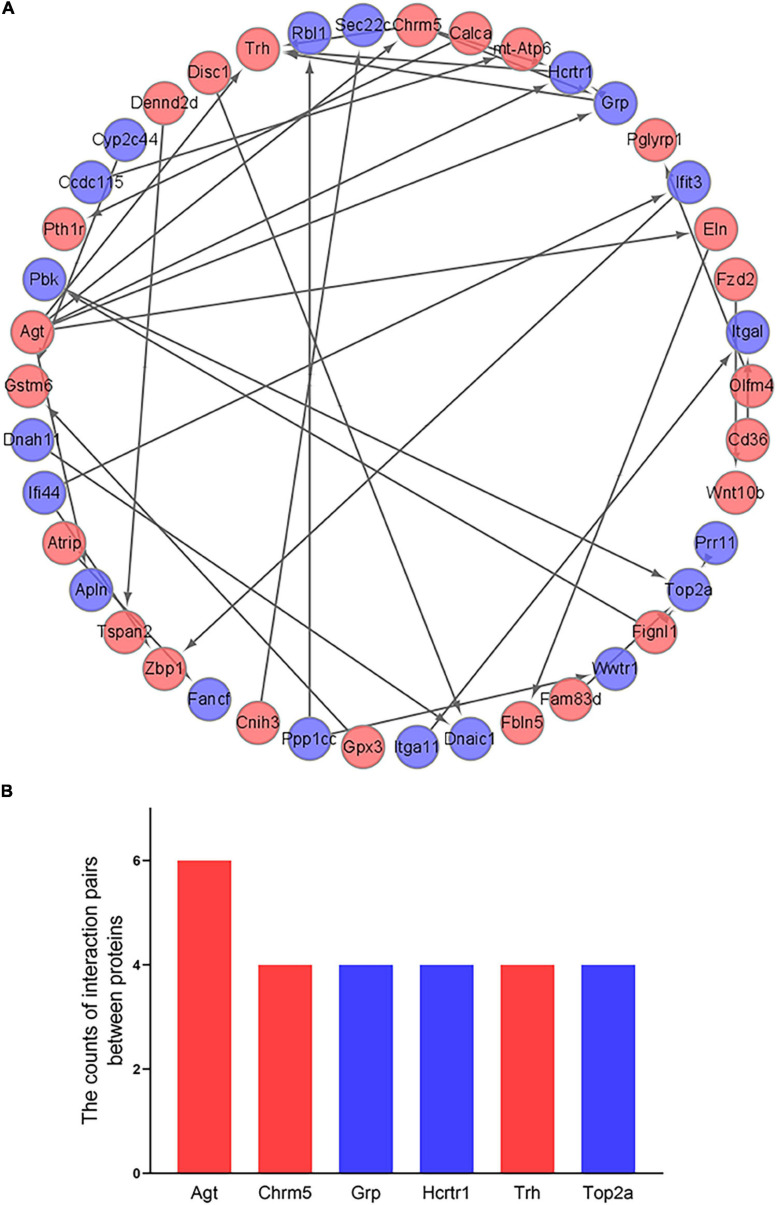
FIGURE 6.
Construction of PPI network and identification of hub genes. (A) Visualization of PPI network. The red points represent 23 up-regulated genes and the blue points represent 19 down-regulated genes. (B) Identification of the top 6 hub genes. The red bars represent up-regulated genes and the blue bars represent down-regulated genes.

