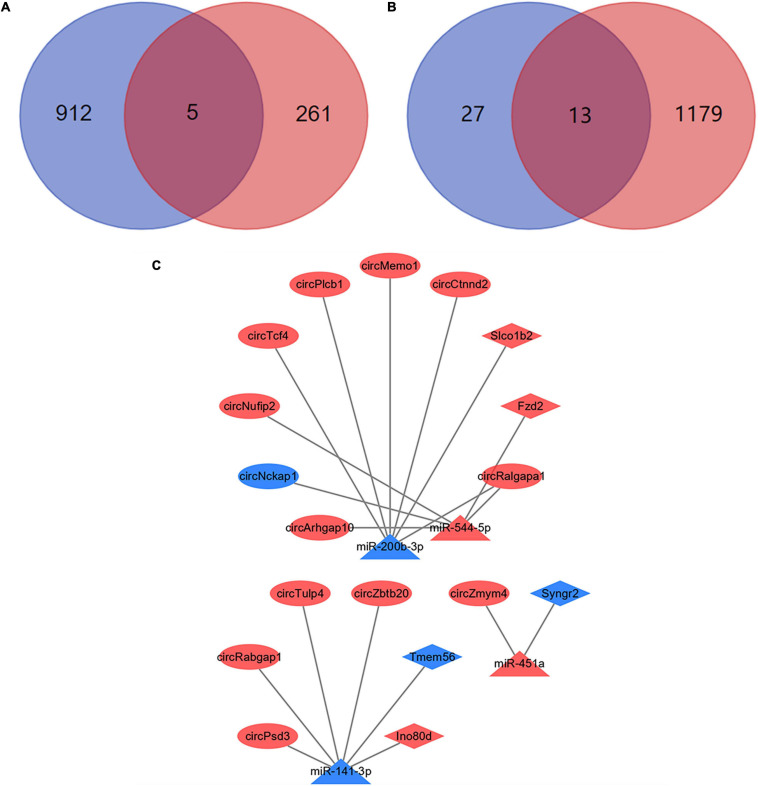
FIGURE 7.
Construction of ceRNA networks. (A) A total of 5 mRNAs were identified with miRNA targeting binding sites. The blue circle represents the results of bioinformatics databases and the red circle represents the NGS results. (B) A total of 13 circRNAs were identified with miRNA targeting binding sites. The blue circle represents the results of bioinformatics databases and the red circle represents the NGS results. (C) Visualization of ceRNA networks. The red marks represent the up-regulated genes and the blue marks represent the down-regulated genes.

